The van der Waals equation is an equation of state that relates the pressure, molar volume, and temperature in fluids. It describes both the liquid and gas states. It was the first successful thermodynamic model to treat fluids as being composed of molecules with finite size and with intermolecular interactions.
The equation is named after Dutch physicist Johannes Diderik van der Waals, who first derived it in 1873 as part of his doctoral thesis. Van der Waals based the equation on the idea that fluids are composed of discrete particles, which few scientists believed existed. However, the equation accurately predicted the behavior of a fluid around its critical point, which had been discovered a few years earlier. Its qualitative and quantitative agreement with experiments ultimately cemented its acceptance in the scientific community. These accomplishments won Van der Waals the 1910 Nobel Prize in Physics.[1] Today the equation is recognized as an important model of phase change in fluids.[2]
The van der Waals equation represents fluids whose intermolecular potential can be approximated as hard repulsion with weak attraction at a distance.[3]
where is pressure, is absolute temperature, is the gas constant, and is molar volume, the ratio of volume, , to the number of moles in the gas, . The constants and are experimentally determinable, substance-specific constants. This form is useful for plotting isotherms (constant temperature curves).
Figure A: Van der Waals equation on a wall in Leiden
Van der Waals wrote it in an equivalent, explicit in temperature, form in his thesis[6][7] (although he could not denote absolute temperature by its modern form in 1873)
1b
This form is useful for plotting isobars (constant pressure curves). Writing , and multiplying both sides by , the equation has the form that appears in Figure A (in which pressure is capitalized and the number of moles is lower cased).[8]
When Van der Waals created his equation, few scientists believed that fluids were composed of rapidly moving particles. Moreover, those who thought so did not know the atomic/molecular structure. The simplest conception of a particle, and the easiest to model mathematically, was a hard sphere of volume ; this is what Van der Waals used, and he found the total excluded volume was , namely 4 times the volume of all the particles.[9][10] The constant , has the dimension of molar volume, [v]. The constant expresses the strength of the hypothesized inter-particle attraction. Van der Waals only had Newton's law of gravitation, in which two particles are attracted in proportion to the product of their masses, as a model. Thus he argued that, in his case, the attractive pressure was proportional to the density squared.[11] The proportionality constant, a, when written in the form used above, has the dimension [pv2] (pressure times molar volume squared).
Figure B: The Sutherland potential (orange) represents two hard spheres that attract according to an inverse power law, and the Lennard-Jones potential (black) represents the induced-dipole–induced-dipole interaction of two non-polar molecules. Both are simple realistic molecular models.
The force magnitude between two spherically symmetric molecules is written as , where is the pair potential function, and the force direction is along the line connecting the two mass centers. The specific functional relation is most simply characterized by a single length, , and a minimum energy, (with ). Two of the many such functions that have been suggested are shown in Fig. B.[12]
A modern theory based on statistical mechanics produces the same result for obtained by Van der Waals and his contemporaries. It also produces a constant value for when is small enough.[13][14]
Once the constants and are known for a given substance, the van der Waals equation can be used to predict attributes like the boiling point at any given pressure, and the critical point.[15] These predictions are accurate for only a few substances. Most simple fluids are only a valuable approximation.[16][17]
Relationship to the ideal gas law
The ideal gas law follows from the van der Waals equation whenever the molar volume is sufficiently large (when , so ), or equivalently whenever the molar density, , is sufficiently small (when , so ).[18]
When is large enough that both inequalities are satisfied, these two approximations reduce the van der Waals equation to , or . Using the definition given after Eq (1a), this becomes ; either of these forms expresses the ideal gas law.[18] This is unsurprising since the van der Waals equation was constructed from the ideal gas equation to obtain an equation valid beyond the low-density limit of ideal gas behavior.
What is truly remarkable is the extent to which Van der Waals succeeded. Indeed, Paul Sophus Epstein in his classic thermodynamics textbook began his discussion of the van der Waals equation by writing, "Despite its simplicity, it comprehends both the gaseous and the liquid state and brings out, in a most remarkable way, all the phenomena pertaining to the continuity of these two states".[18] Also, in Volume 5 of his Lectures on Theoretical Physics, Arnold Sommerfeld, in addition to noting that "Boltzmann[19] described Van der Waals as the Newton of real gases",[7] also wrote "It is very remarkable that the theory due to Van der Waals is in a position to predict, at least qualitatively, the unstable [referring to superheated liquid, and subcooled vapor, now called metastable] states" that are associated with the phase change process.[20]
In 1857 Rudolf Clausius published The Nature of the Motion which We Call Heat. In it he derived the relation for the pressure in a gas, composed of particles in motion, with number density , mass , and mean square speed . He then noted that using the classical laws of Boyle and Jacques Charles, one could write with a constant of proportionality . Hence temperature was proportional to the average kinetic energy of the particles.[22] This article inspired further work based on the twin ideas that substances are composed of indivisible particles, and that heat is a consequence of the particle motion; movement that evolves according to Newton's laws. The work, known as the kinetic theory of gases, was done principally by Clausius, James Clerk Maxwell, and Ludwig Boltzmann. At about the same time, Josiah Willard Gibbs advanced the work by converting it into statistical mechanics.[23][24]
This environment influenced Johannes Diderik van der Waals. After initially pursuing a teaching credential, he was accepted for doctoral studies at the University of Leiden under Pieter Rijke.[25] This led, in 1873, to a dissertation that provided a simple, particle-based equation that described the gas-liquid change of state, the origin of a critical temperature, and the concept of corresponding states.[26][27] The equation is based on two premises: first, that fluids are composed of particles with non-zero volumes, and second, that at a large enough distance each particle exerts an attractive force on all other particles in its vicinity. Boltzmann called these forces van der Waals cohesive forces.[28]
In 1869 Irish professor of chemistry Thomas Andrews at Queen's University Belfast, in a paper entitled On the Continuity of the Gaseous and Liquid States of Matter,[29] displayed an experimentally obtained set of isotherms of carbonic acid, H2CO3, that showed at low temperatures a jump in density at a certain pressure, while at higher temperatures there was no abrupt change (the figure can be seen here). Andrews called the isotherm at which the jump disappears the critical point. Given the similarity of the titles of this paper and Van der Waals' subsequent thesis, one might think that Van der Waals set out to develop a theoretical explanation of Andrews' experiments; however, this is not what happened. Van der Waals began work by trying to determine a molecular attraction that appeared in Laplace's theory of capillarity, and only after establishing his equation he tested it using Andrews' results.[30][31]
By 1877 sprays of both liquid oxygen and liquid nitrogen had been produced, and a new field of research, low-temperature physics, had been opened. The van der Waals equation played a part in all this, especially for the liquefaction of hydrogen and helium which was finally achieved in 1908.[32] From measurements of and in two states with the same density, the van der Waals equation produces the values[33]
Thus from two such measurements of pressure and temperature, one could determine and , and from these values calculate the expected critical pressure, temperature, and molar volume. David Goodstein summarized this contribution of the van der Waals equation as follows:[34]
All this labor required considerable faith in the belief that gas–liquid systems were all basically the same, even if no one had ever seen the liquid phase. This faith arose out of the repeated success of the van der Waals theory, which is essentially a universal equation of state, independent of the details of any particular substance once it has been properly scaled. [...] As a result, not only was it possible to believe that hydrogen could be liquefied, but it was even possible to predict the necessary temperature and pressure.
Van der Waals was awarded the Nobel Prize in Physics in 1910, in recognition of the contribution of his formulation of this "equation of state for gases and liquids."[1]
Use
Van der Waals assumed that the molecules represented in the equation of state had hard sphere repulsion and weak attraction at distance. The Sutherland potential is an example of this interaction.[11] Many liquid metals are approximated by the Sutherland potential; and some are well represented by van der Waals’ equation of state.[3]
The van der Waals equation has been, and remains, useful because:[35]
Its coefficient of thermal expansion has a simple analytic expression
Its internal energy and entropy have simple analytic expressions
Its specific heat at constant volume is a function of only
Its specific heat at constant pressure, has a simple relationship with
Its Joule–Thomson coefficient and associated inversion curve, which are instrumental in the commercial liquefaction of gases, have simple analytic expressions
Its enthalpy and free energies all have simple analytic expressions
Its isothermal compressibility has a simple analytic expression
Its saturation curve has a simple analytic parametric solution
It is an intermediate mathematical model that is useful as a pedagogical tool when teaching physics, chemistry, and engineering
and
It plays an important role in the modern theory of phase transitions[37]
It is the completely accurate equation of state for substances whose intermolecular potential matches the Sutherland potential[3]
Note that the van der Waals equation requires to produce valid results. This observation shouldn't be surprising given that if , then the density of the fluid under analysis has likely been overstated. For example, if one tries to model a steam tank with capacity 7500 L containing 10 megagrams of steam, then the density of water is grossly (unphysically) overstated, and will lead to a negative calculated pressure.
Critical point and corresponding states
Figure 1: Four isotherms of the van der Waals equation along with the spinodal curve (black dash-dot curve) and the coexistence (saturation) curve (red dash-dot curve), plotted using reduced (dimensionless) variables. The critical point lies at the inflection point on the orange isotherm.
Figure1 shows four isotherms of the van der Waals equation (abbreviated as vdW) on a (pressure, molar volume) plane. The essential character of these curves is that they come in three forms:
At some critical temperature (orange isotherm), the slope is negative everywhere except at a single inflection point: the critical point , where both the slope and curvature are zero, .
At higher temperatures (red isotherm), the isotherm's slope is negative everywhere. (This corresponds to values of for which the vdW equation has one real root for ).
At lower temperatures (green and blue isotherms), all isotherms have two points with zero slope. (This corresponds to values of , for which the vdW equation has three real roots for ).
The critical point can be analytically determined by equating the two partial derivatives of the vdW equation, created by differentiating Eq (1a), to zero. This produces the critical values and . Finally, using these values in Eq (1a) gives .[38] These results can also be obtained algebraically by noting that at the critical point the three roots are equal. Hence, Eqs (1) can be written as either , or ; two forms with the same coefficients.[39][40]
Course of the isotherms
Above the critical temperature , van der Waals isotherms satisfy the stability criterion that . Below the critical temperature, each isotherm contains an interval where this condition is violated. This unstable region is the genesis of the phase change; there is a range , for which no observable states exist. The states for are liquid, and those for are vapor; the denser liquid separates and lies below the vapor due to gravity. The transition points, states with zero slope, are called spinodal points.[41] Their locus is the spinodal curve, a boundary that separates the regions of the plane for which liquid, vapor, and gas exist from a region where no observable homogeneous states exist. This spinodal curve is obtained here from the vdW equation by differentiation (or equivalently from ) as
A projection of the spinodal curve is plotted in Figure1 as the black dash-dot curve. It passes through the critical point, which is also a spinodal point.
Principle of corresponding states
Using the critical values to define reduced (dimensionless) variables , , and renders the vdW equation in the dimensionless form (used to construct Fig. 1):
This dimensionless form is a similarity relation; it indicates that all vdW fluids at the same will plot on the same curve. It expresses the law of corresponding states which Boltzmann described as follows:[42]
All the constants characterizing the gas have dropped out of this equation. If one bases measurements on the van der Waals units [Boltzmann's name for the reduced quantities here], then he obtains the same equation of state for all gases. [...] Only the values of the critical volume, pressure, and temperature depend on the nature of the particular substance; the numbers that express the actual volume, pressure, and temperature as multiples of the critical values satisfy the same equation for all substances. In other words, the same equation relates the reduced volume, reduced pressure, and reduced temperature for all substances.
Obviously such a broad general relation is unlikely to be correct; nevertheless, the fact that one can obtain from it an essentially correct description of actual phenomena is very remarkable.
This "law" is just a special case of dimensional analysis in which an equation containing 5 dimensional quantities, , and 3 independent dimensions, [p], [v], [T], must be expressible in terms of 5 − 3 = 2 dimensionless groups.[43] Here is a characteristic molar volume, a characteristic pressure, and a characteristic temperature, and the 2 dimensionless groups are . According to dimensional analysis the equation must then have the form , a general similarity relation. In his discussion of the vdW equation, Sommerfeld also mentioned this point.[44] The reduced properties defined previously are , , and . Recent research has suggested that there is a family of equations of state that depend on an additional dimensionless group, and this provides a more exact correlation of properties.[45] Nevertheless, as Boltzmann observed, the van der Waals equation provides an essentially correct description.
The vdW equation produces the critical compressibility factor , while for most real fluids .[46] Thus most real fluids do not satisfy this condition, and consequently their behavior is only described qualitatively by the vdW equation. However, the vdW equation of state is a member of a family of state equations based on the Pitzer (acentric) factor, , and the liquid metals are well approximated by it.[17][3]
Thermodynamic properties
The properties molar internal energy, , and entropy, , are defined by the first and second laws of thermodynamics. From these laws, they, and all other thermodynamic properties of a simple compressible substance, can be specified, up to a constant of integration, by two measurable functions. These are a mechanical equation of state, , and a constant volume specific heat, .[47][48]
When represents a continuous surface, it must be a continuous function with continuous partial derivatives, and its second mixed partial derivatives must be equal, . Then with this condition can be written simply as . Differentiating for the vdW equation gives , so . Consequently the numeric specific heat for a vdW fluid exactly as it is for an ideal gas.[49] To keep things simple, it is regarded as a constant number in the following.
Internal energy, and entropy
The energetic equation of state gives the internal energy, and the entropic equation of state gives the entropy as[50][48]
where are arbitrary constants of integration.
Both integrals for can be easily evaluated and the result is, [51][52]
2
Likewise both integrals for can be evaluated with the result,[46][53]
All these results can be rendered in reduced form by using the characteristic energy .
Derivatives: α, κT and cp
Any derivative of any thermodynamic property can be expressed in terms of any three of them.[56] A standard set is composed of . For a vdW fluid is a known function, and the other two are obtained from the first partial derivatives of the vdW equation as,
Here , is the isothermal compressibility, and , is the coefficient of thermal expansion.[57][58] Therefore,[59][60]
5
In the limit , and .[60][61] Since the vdW equation in this limit becomes , finally . Both of these are the ideal gas values.
The specific heat at constant pressure, is defined as the partial derivative . It is related to by the Mayer equation, .[62][63] Then the two partials of the vdW equation can be used to express as,[55]
6
Here in the limit , , which is also the ideal gas result for Meyer relation;[55] however the limit gives the same result, which does not agree with experiments on liquids.[61]
Finally , and are all infinite on the curve .[55] This is the spinodal curve defined by ,[64] that was discussed in the subsection The course of the isotherms.
Saturation
Although the gap in delimited by the two spinodal points on an isotherm (e.g. in Fig. 1) is the origin of the phase change, the change occurs at some intermediate value of pressure. This can be understood by considering that the saturated liquid and vapor states can coexist in equilibrium, with the same pressure and temperature.[65] However, the minimum and maximum spinodal points are not at the same pressure. Therefore, at a temperature , the phase change is characterized by the pressure , which lies within the range of set by the spinodal points (), and by the molar volume of liquid and vapor , which lie outside the range of set by the spinodal points ( and ).
Applying Eq (1a) to the saturated liquid and saturated vapor states gives:
7
Equations (7) contain four variables ), so a third equation is required to uniquely specify three of these variables in terms of the fourth. In this case of a single substance, the equation is provided by the condition of equal Gibbs free energy,[65]
Using Eq (4b) applied to each state in this equation produces
8
This is a third equation that, along with Eqs. 7 can be solved numerically. This has been done given a value for either or , and tabular results presented;[66][67] however, the equations also admit an analytic parametric solution obtained by Lekner.[68] Details of this solution may be found in the Maxwell construction, and the dimensionless results are:
where
The parameter is given physically by . This solution also produces values of all other property discontinuities across the saturation curve.[69] These functions define the coexistence curve (or saturation curve), which is the locus of the saturated liquid and saturated vapor states of the vdW fluid. Projections of this saturation curve are plotted in Figures1 and 2.
Figure 2: The black dash-dot curve is the spinodal curve (stability limit) and the blue dash-dot curve is the coexistence (saturation) curve, plotted in the plane.
Referring back to Figure1, the isotherms for are discontinuous. For example, the (green) isotherm consists of two separate segments. The solid green lines are composed of stable states. They terminate at dots representing the saturated liquid and vapor states forming the phase change. The dashed green lines represent metastable states (superheated liquid and subcooled vapor). They are created in the phase transition, have a finite lifetime, and then devolve into their lower energy stable alternative.
At every point in the region between the two curves in Figure2, there are two states: one stable and one metastable. The coexistence of these states can be seen in Figure1—for discontinuous isotherms, there are values of which correspond to two points on the isotherm: one on a solid line (the stable state) and one on a dashed region (the metastable state).
In his treatise of 1898, in which he described the van der Waals equation in great detail, Boltzmann discussed these metastable states in a section titled "Undercooling, Delayed evaporation".[70] (Today, these states are now denoted "subcooled vapor" and "superheated liquid".) Moreover, it has now become clear that these metastable states occur regularly in the phase transition process. In particular, processes that involve very high heat fluxes create large numbers of these states, and transition to their stable alternative with a corresponding release of energy that can be dangerous. Consequently, there is a pressing need to study their thermal properties.[71]
In the same section, Boltzmann also addressed and explained the negative pressures which some liquid metastable states exhibit (for example, the blue isotherm in Fig. 1). He concluded that such liquid states of tensile stresses were real, as did Tien and Lienhard many years later who wrote "The van der Waals equation predicts that at low temperatures liquids sustain enormous tension [...] In recent years measurements have been made that reveal this to be entirely correct."[72]
Even though the phase change produces a mathematical discontinuity in the homogeneous fluid properties (for example ), there is no physical discontinuity.[73] As the liquid begins to vaporize, the fluid becomes a heterogeneous mixture of liquid and vapor whose molar volume varies continuously from to according to the equation of state where and is the mole fraction of the vapor. This equation is called the lever rule and applies to other properties as well.[20][73] The states it represents form a horizontal line bridging the discontinuous region of an isotherm (not shown in Fig. 1 because it is a different equation from the vdW equation).
Extended corresponding states
Figure 3: The family of saturation curves, showing the vdW curve as a member (blue curve). The blue dots are calculated from Lekner's solution. The orange dots are calculated from data in the ASME Steam Tables Compact Edition, 2006.
The idea of corresponding states originated when Van der Waals cast his equation in the dimensionless form, . However, as Boltzmann noted, such a simple representation could not correctly describe all substances. Indeed, the saturation analysis of this form produces ; namely, that all substances have the same dimensionless coexistence curve, which is not true.[74] To avoid this paradox, an extended principle of corresponding states has been suggested in which where is a substance-dependent dimensionless parameter related to the only physical feature associated with an individual substance: its critical point.
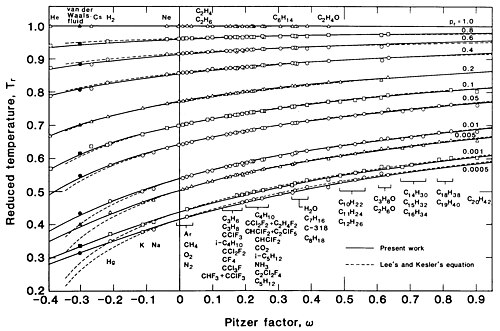
Figure 4: A plot of the correlation including data from various substances.
One candidate for is the critical compressibility factor ; however, because is difficult to measure accurately, the acentric factor developed by Kenneth Pitzer,[75], is more useful. The saturation pressure in this situation is represented by a one-parameter family of curves: . Several investigators have produced correlations of saturation data for several substances; Dong and Lienhard give[3] which has an RMS error of over the range .
Figure3 is a plot of vs. for various values of the Pitzer factor as given by this equation. The vertical axis is logarithmic to show the behavior at pressures closer to zero, where differences among the various substances (indicated by varying values of ) are more pronounced.
Figure4 is another plot of the same equation showing as a function of for various values of . It includes data from 51 substances, including the vdW fluid, over the range . This plot shows that the vdW fluid () is a member of the class of real fluids; indeed, the vdW fluid can quantitatively approximate the behavior of the liquid metals cesium () and mercury (), which share similar values of . However, in general it can describe the behavior of fluids of various only qualitatively.
Joule–Thomson coefficient
The Joule–Thomson coefficient, , is of practical importance because the two end states of a throttling process () lie on a constant enthalpy curve. Although ideal gases, for which , do not change temperature in such a process, real gases do, and it is important in applications to know whether they heat up or cool down.[76]
This coefficient can be found in terms of the previously derived and as[77]
When is positive, the gas temperature decreases as it passes through a throttling process, and when it is negative, the temperature increases. Therefore, the condition defines a curve that separates the region of the plane where from the region where . This curve is called the inversion curve, and its equation is . Evaluating this using the expression for derived in Eq. 5 produces,[78]
Figure 5: Curves of constant enthalpy in this plane have negative slope above this (green) inversion curve, positive slope below it, and zero slope on it; they are S-shaped. A gas entering a throttle at a state corresponding to a point on this curve to the right of its maximum will cool if the final state is below the curve. Right: a close-up of the region between zero and the critical point (1,1), showing the overlap between the inversion curve (green) and saturation curve (dashed purple).
Note that for there will be cooling for (or, in terms of the critical temperature, ). As Sommerfeld noted, "This is the case with air and with most other gases. Air can be cooled at will by repeated expansion and can finally be liquified."[78]
Solving for , and using this to eliminate from Eq (1a) gives the inversion curve as
where, for simplicity, have been replaced by .
A plot of the curve, in reduced variables, is shown in green in Figure5. Sommerfeld also displays this plot,[79] together with a curve drawn using experimental data from H2. The two curves agree qualitatively, but not quantitatively. Figure5 shows an overlap between the saturation curve and the inversion curve plotted in the same region. This crossover means a van der Waals gas can be liquified by passing it through a throttling process under the proper conditions; real gases are liquified in this way.
Compressibility factor
Figure 6: Isotherms plotted against the compressibility factor . The horizontal axis is . The isotherms, spinodal curve, and coexistence curve here are the same as in Fig. 1. Additionally plotted are the isotherm , which has zero slope at the origin, and the isotherm .Figure 7: Generalized compressibility chart for a van der Waals gas.
Real gases are characterized by their difference from ideal gases by writing , where , called the compressibility factor. It is expressed either as or , because in either case (pressure, , or density, ) the limit as or approaches zero is 1, and takes the ideal gas value. In the second case ,[80] so for a van der Waals fluid from Eq (‘’’1’’’) the compressibility factor is
9
or in terms of reduced variables where . At the critical point, and .
In the limit , ; the fluid behaves like an ideal gas, as mentioned before. The derivative is never negative when ; that is, when (which corresponds to ). Alternatively, the initial slope is negative when , is zero at , and is positive for larger (see Fig. 6). In this case, the value of passes through when . Here is called the Boyle temperature. It ranges between , and denotes a point in space where the equation of state reduces to the ideal gas law. However, the fluid does not behave like an ideal gas there, because neither its derivatives nor reduce to their ideal gas values, other than where the actual ideal gas region.[81]
Figure6 plots various isotherms of vs . Also shown are the spinodal and coexistence curves described previously. The subcritical isotherm consists of stable, metastable, and unstable segments (identified in the same way as in Fig. 1). Also included are the zero initial slope isotherm and the one corresponding to infinite temperature.
Figure7 shows a generalized compressibility chart for a vdW gas. Like all other vdW properties, this is not quantitatively correct for most gases, but it has the correct qualitative features.[82][83] Note the caustic generated by the crossing isotherms.
Virial expansion
Kammerlingh Onnes first suggested the virial expansion as an empirical alternative to the vdW equation. Subsequently, it was proven to result from Statistical mechanics,[84][85] in the form where and the functions are the virial coefficients. The th term represents a -particle interaction.
Expanding the term in the definition of , Eq (9), into an infinite series, absolutely convergent for , produces
The second virial coefficient is the slope of at . It is positive when and negative when (), in agreement with the result found by differentiation. Its vdW value, agrees with a statistical mechanical calculation; however, the higher order coefficients are in error. This means that the vdW virial expansion, hence the vdW equation itself, is equivalent to a two term asymptotic approximation to the virial equation.[14][86]
For molecules modeled as non-attracting hard spheres, , and the vdW virial expansion becomes which illustrates the effect of the excluded volume alone. It was recognized early on that this was in error beginning with the term . Boltzmann calculated its correct value as , and used the result to propose an enhanced version of the vdW equation:
On expanding , this produced the correct coefficients through and also gave infinite pressure at , which is approximately the close-packing distance for hard spheres.[87] This was one of the first of many equations of state proposed over the years that attempted to make quantitative improvements to the remarkably accurate explanations of real gas behavior produced by the vdW equation.[88]
Mixtures
In 1890 Van der Waals published an article that initiated the study of fluid mixtures. It was subsequently included as Part III of a later published version of his thesis.[89] His essential idea was that in a binary mixture of vdW fluids described by the equations the mixture is also a vdW fluid given by where
Here and , with (so that ), are the mole fractions of the two fluid substances. Adding the equations for the two fluids shows that , although for sufficiently large with equality holding in the ideal gas limit. The quadratic forms for and are a consequence of the forces between molecules. This was first shown by Lorentz,[90] and was credited to him by Van der Waals. The quantities and in these expressions characterize collisions between two molecules of the same fluid component, while and represent collisions between one molecule of each of the two different fluid components. This idea of Van der Waals was later called a one fluid model of mixture behavior.[91]
Assuming that is the arithmetic mean of and , , substituting into the quadratic form and noting that produces
Van der Waals wrote this relation, but did not make use of it initially.[92] However, it has been used frequently in subsequent studies, and its use is said to produce good agreement with experimental results at high pressure.[93]
Common tangent construction
In this article, Van der Waals used the Helmholtz potential minimum principle to establish stability conditions. This principle states that in a system in diathermal contact with a heat reservoir , , and , namely at equilibrium, the Helmholtz potential is a minimum.[94] Since, like , the molar Helmholtz function is also a potential function whose differential is this minimum principle leads to the stability condition . This condition means that the function, , is convex at all stable states of the system. Moreover, for those states the previous stability condition for the pressure is also necessarily satisfied.[95]
Single fluid
For a single substance, the definition of the molar Gibbs free energy can be written in the form . Thus when and are constant, the function is a straight line with slope , and intercept . Since the curve has positive curvature everywhere when , the curve and the straight line will have a single tangent. However, for a subcritical is not everywhere convex. With and a suitable value of , the line will be tangent to at the molar volume of each coexisting phase: saturated liquid and saturated vapor ; there will be a double tangent. Furthermore, each of these points is characterized by the same values of , , and These are the same three specifications for coexistence that were used previously.[95]
Figure 8: The tangent line (black) to the curve (green) at the two points and . The line's slope, given by , is corresponding to . This is the same data as isotherm in Fig. 1. The intercept on the line is , but its numerical value is arbitrary due to a constant of integration.
Figure8 depicts an evaluation of as a green curve, with and marked by the left and right green circles, respectively. The region on the green curve for corresponds to the liquid state. As increases past , the curvature of (proportional to ) continually decreases. The inflection point, characterized by zero curvature, is a spinodal point; between and this point is the metastable superheated liquid. For further increases in the curvature decreases to a minimum then increases to another (zero curvature) spinodal point; between these two spinodal points is the unstable region in which the fluid cannot exist in a homogeneous equilibrium state (represented by the dotted grey curve). With a further increase in the curvature increases to a maximum at , where the slope is ; the region between this point and the second spinodal point is the metastable subcooled vapor. Finally, the region is the vapor. In this region the curvature continually decreases until it is zero at infinitely large . The double tangent line (solid black) that runs between and represents states that are stable but heterogeneous, not homogeneous solutions of the vdW equation.[95] The states above this line (with larger Helmholtz free energy) are either metastable or unstable.[95] The combined solid green-black curve in Figure8 is the convex envelope of , which is defined as the largest convex curve that is less than or equal to the function.[96]
For a vdW fluid, the molar Helmholtz potential is given by Eq (4a). This is, in reduced form,
with derivative . A plot of this function , whose slope at each point is given by of the vdW equation, for the subcritical isotherm is shown in Figure8 along with the line tangent to it at its two coexisting saturation points. The data illustrated in Figure8 is the same as that shown in Figure1 for this isotherm.[95]
This double tangent construction thus provides a graphical alternative to the Maxwell construction to establish the saturated liquid and vapor points on an isotherm.[95]
Binary fluid
Van der Waals used the Helmholtz function because its properties could be easily extended to the binary fluid situation. In a binary mixture of vdW fluids, the Helmholtz potential is a function of two variables, , where is a composition variable (for example so ). In this case, there are three stability conditions:[97]
and the Helmholtz potential is a surface (of physical interest in the region ). The first two stability conditions show that the curvature in each of the directions and are both non-negative for stable states, while the third condition indicates that stable states correspond to elliptic points on this surface.[98] Moreover, its limit specifies the spinodal curves on the surface.
For a binary mixture, the Euler equation[99] can be written in the form where are the molar chemical potentials of each substance, . For constant values of , , and , this equation is a plane with slopes in the direction, in the direction, and intercept . As in the case of a single substance, here the plane and the surface can have a double tangent, and the locus of the coexisting phase points forms a curve on each surface. The coexistence conditions are that the two phases have the same , , , and ; the last two are equivalent to having the same and individually, which are just the Gibbs conditions for material equilibrium in this situation. The two methods of producing the coexistence surface are equivalent.[97]
Although this case is similar to that of a single fluid, here the geometry can be much more complex. The surface can develop a wave (called a plait or fold) in the direction as well as the one in the direction. Therefore, there can be two liquid phases that can be either miscible, or wholly or partially immiscible, as well as a vapor phase.[100][101] Despite a great deal of both theoretical and experimental work on this problem by Van der Waals and his successors—work which produced much useful knowledge about the various types of phase equilibria that are possible in fluid mixtures[102]—complete solutions to the problem were only obtained after 1967, when the availability of modern computers made calculations of mathematical problems of this complexity feasible for the first time.[103] The results obtained were, in Rowlinson's words,[104]
a spectacular vindication of the essential physical correctness of the ideas behind the van der Waals equation, for almost every kind of critical behavior found in practice can be reproduced by the calculations, and the range of parameters that correlate with the different kinds of behavior are intelligible in terms of the expected effects of size and energy.
Mixing rules
To obtain these numerical results, the values of the constants of the individual component fluids must be known. In addition, the effect of collisions between molecules of the different components, given by and , must also be specified. In the absence of experimental data, or computer modeling results to estimate their value, the empirical combining rules, geometric and algebraic means can be used, respectively:[105]
These relations correspond to the empirical combining rules for the intermolecular force constants, the first of which follows from a simple interpretation of the dispersion forces in terms of polarizabilities of the individual molecules, while the second is exact for rigid molecules.[106] Using these empirical combining rules to generalize for fluid components, the quadratic mixing rules for the material constants are:[93]
These expressions come into use when mixing gases in proportion, such as when producing tanks of air for diving[107] and managing the behavior of fluid mixtures in engineering applications. However, more sophisticated mixing rules are often necessary, to obtain satisfactory agreement with reality over the wide variety of mixtures encountered in practice.[108][109]
Another method of specifying the vdW constants, pioneered by W.B. Kay and known as Kay's rule,[110] specifies the effective critical temperature and pressure of the fluid mixture by
In terms of these quantities, the vdW mixture constants are which Kay used as the basis for calculations of the thermodynamic properties of mixtures. Kay's idea was adopted by T. W. Leland, who applied it to the molecular parameters , which are related to through by and . Using these together with the quadratic mixing rules for produces which is the van der Waals approximation expressed in terms of the intermolecular constants.[111][112] This approximation, when compared with computer simulations for mixtures, are in good agreement over the range , namely for molecules of similar diameters. Rowlinson said of this approximation, "It was, and indeed still is, hard to improve on the original van der Waals recipe when expressed in [this] form".[113]
Validity of the equation
Since Van der Waals presented his thesis, "[m]any derivations, pseudo-derivations, and plausibility arguments have been given" for it.[114] However, no mathematically rigorous derivation of the equation over its entire range of molar volume that begins from a statistical mechanical principle exists. Indeed, such a proof is not possible, even for hard spheres.[115][116][117][118][119] Goodstein writes, "Obviously the value of the van der Waals equation rests principally on its empirical behavior rather than its theoretical foundation."[8]
Although the use of the Van der Waals equation is not justified mathematically, it has empirical validity. Its various applications in this region that attest to this, both qualitative and quantitative, have been described previously in this article. This point was also made by Berni Alder, et al. who, at a conference marking the 100th anniversary of Van der Waals' thesis, noted that:[120]
It is doubtful whether we would celebrate the centennial of the van der Waals equation if it were applicable only under circumstances where it has been proven to be rigorously valid. It is empirically well established that many systems whose molecules have attractive potentials that are neither long-range nor weak conform nearly quantitatively to the van der Waals model. An example is the theoretically much studied system of argon, where the attractive potential has only a range half as large as the repulsive core.
They continued by saying that this model has "validity down to temperatures below the critical temperature, where the attractive potential is not weak at all but, in fact, comparable to the thermal energy." They also described its application to mixtures "where the van der Waals model has also been applied with great success. In fact, its success has been so great that not a single other model of the many proposed since, has equalled its quantitative predictions,[121] let alone its simplicity."[122]
Engineers have made extensive use of this empirical validity, modifying the equation in numerous ways (by one account there have been some 400 cubic equations of state produced)[123] to manage the liquids,[124] and gases of pure substances and mixtures,[125] that they encounter in practice.
This situation has been aptly described by Boltzmann:[126]
... Van der Waals has given us such a valuable tool that it would cost us much trouble to obtain by the subtlest deliberations a formula that would really be more useful than the one that Van der Waals found by inspiration, as it were.
Andrews, T. (1869). "On the Continuity of the Gaseous and Liquid States of Matter". Philosophical Transactions of the Royal Society of London. 159: 575–590.
Barenblatt, G.I. (1979) [1978], Similarity, Self-Similarity, and Intermediate Asymptotics, translated by Stein, Norman, NY and London: Milton
Barrufet, M.A.; Eubank, P.T. (1989). "Generalized Saturation Properties of Pure Fluids Via Cubic Equations of State". Chemical Engineering Education. 23 (3): 168–175.
Boltzmann, L. (1995) [1967, original in German 1896 (Part I), 1898 (Part II)]. Lectures on Gas Theory. Translated by Brush, S.G. NY: Dover.
Dong, W.G.; Lienhard, J.H. (1986). "Corresponding States Correlation of Saturated and Metastable Properties". Can J Chem Eng. 64: 158–161. doi:10.1002/cjce.5450640123.
Epstein, P.S. (1937). Textbook of Thermodynamics. NY: John Wiley and Sons.
Gibbs, J.W. (1948) [1901]. The Collected Works of J. Willard Gibbs Volume II Part One Elementary Principles in Statistical Mechanics. New Haven: Yale University Press.
Kac, M.; Uhlenbeck, G.E.; Hemmer, P.C. (1963). "On the van der Waals Theory of the Vapor-Liquid Equilibrium. 1. Discussion of a One-Dimensional Model". J. Math. Phys. 4 (2): 216–228. Bibcode:1963JMP.....4..216K. doi:10.1063/1.1703946.
Kreyszig, E. (1959). Differential Geometry. Toronto: University of Toronto Press.
Kontogeorgis, G.M.; Privat, R.; Jaubert, J-N.J. (2019). "Taking Another Look at the van der Waals Equation of State – Almost 150 Years Later". J. Chem. Eng. Data. 64 (11): 4619–4637. doi:10.1021/acs.jced.9b00264.
Leland, T. W.; Rowlinson, J.S.; Sather, G.A. (1968). "Statistical thermodynamics of mixtures of molecules of different sizes". Trans. Faraday Soc. 64: 1447–1460. doi:10.1039/tf9686401447.
Lienhard, J.H. (1986). "The Properties and Behavior of Superheated Liquids". Lat. Am. J. Heat and Mass Transfer. 10: 169–187.
Niemeyer, Kyle. "Mixture properties". Computational Thermodynamics. Archived from the original on 2 April 2024. Retrieved 2 April 2024.
Peck, R.E. (1982). "The Assimilation of van der Waals Equation in the Corresponding States Family". Can. J. Chem. Eng. 60: 446–449. doi:10.1002/cjce.5450600319.
Pitzer, K.S.; Lippman, D.Z.; Curl, R.F.; Huggins, C.M.; Peterson, D.E. (1955). "The Volumetric and Thermodynamic Properties of Fluids. II. Compressibility Factor, Vapor Pressure and Entropy of Vaporization". J. Am. Chem. Soc. 77 (13): 3433–3440. Bibcode:1955JAChS..77.3433P. doi:10.1021/ja01618a002.
Shamsundar, N.; Lienhard, J.H. (1983). "Saturation and Metastable Properties of the van der Waals Fluid". Can J Chem Eng. 61 (6): 876–880. doi:10.1002/cjce.5450610617.
van der Waals, J.D. (1873). Over de Continuïteit van den Gas en Vloeistoftoestand (Ph.D. thesis). Leiden Univ.
van der Waals, Johannes D. (1967) [1910]. "The Equation of State of Gases and Liquids". in Nobel Lectures, Physics 1901–1921. Amsterdam: Elsevier. pp.254–265.
van der Waals, J.D. (2004) [1984]. Rowlinson, J.S. (ed.). On the Continuity of the Gaseous and Liquid States, edited and with an Introduction by J.S. Rowlinson. NY: Dover Phoenix Editions.
Kittel, Charles; Kroemer, Herbert (1980). Thermal Physics (Reviseded.). New York: Macmillan. pp.287–295. ISBN0716710889.
This page is based on this Wikipedia article Text is available under the CC BY-SA 4.0 license; additional terms may apply. Images, videos and audio are available under their respective licenses.


![Figure 6: Isotherms plotted against the compressibility factor
Z
{\displaystyle Z}
. The horizontal axis is
v
*
r
=
r
r
/
3
{\displaystyle v^{*}\rho =\rho _{r}/3}
. The isotherms, spinodal curve, and coexistence curve here are the same as in Fig. 1. Additionally plotted are the isotherm
T
r
=
27
/
8
{\displaystyle T_{r}=27/8}
, which has zero slope at the origin, and the isotherm
T
r
=
[?]
{\displaystyle T_{r}=\infty }
. Vdw Z rho.png](http://upload.wikimedia.org/wikipedia/commons/thumb/6/6d/Vdw_Z_rho.png/500px-Vdw_Z_rho.png)


![Figure 8: The tangent line (black) to the curve
f
r
(
0.875
,
v
r
)
{\displaystyle f_{\text{r}}(0.875,v_{\text{r}})}
(green) at the two points
v
r
f
=
0.576
{\displaystyle v_{rf}=0.576}
and
v
r
g
=
2.71
{\displaystyle v_{rg}=2.71}
. The line's slope, given by
[?]
v
r
f
r
=
-
p
c
v
c
/
T
c
p
r
s
{\displaystyle \partial _{v_{\text{r}}}f_{\text{r}}=-p_{\text{c}}v_{\text{c}}/T_{\text{c}}p_{rs}}
, is
-
0.215
{\displaystyle -0.215}
corresponding to
p
r
s
=
0.5730
{\displaystyle p_{rs}=0.5730}
. This is the same data as isotherm
T
r
=
7
/
8
{\displaystyle T_{\text{r}}=7/8}
in Fig. 1. The intercept on the line is
g
{\displaystyle g}
, but its numerical value is arbitrary due to a constant of integration. Vdw helmholtz1.png](http://upload.wikimedia.org/wikipedia/commons/thumb/2/21/Vdw_helmholtz1.png/500px-Vdw_helmholtz1.png)


