Spinodal

Last updated
A phase diagram displaying spinodal curves, within the binodal coexistence curves and two critical points: an upper and lower critical solution temperature. LCST-UCST plot.svg
A phase diagram displaying spinodal curves, within the binodal coexistence curves and two critical points: an upper and lower critical solution temperature.

In thermodynamics, the limit of local stability with respect to small fluctuations is clearly defined by the condition that the second derivative of Gibbs free energy is zero.

Contents

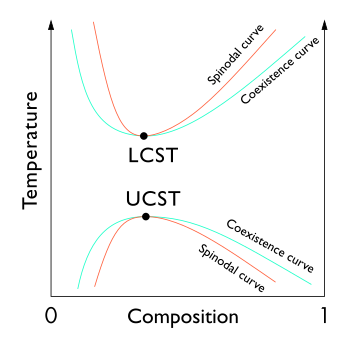
The locus of these points (the inflection point within a G-x or G-c curve, Gibbs free energy as a function of composition) is known as the spinodal curve. [1] [2] [3] For compositions within this curve, infinitesimally small fluctuations in composition and density will lead to phase separation via spinodal decomposition. Outside of the curve, the solution will be at least metastable with respect to fluctuations. [3] In other words, outside the spinodal curve some careful process may obtain a single phase system. [3] Inside it, only processes far from thermodynamic equilibrium, such as physical vapor deposition, will enable one to prepare single phase compositions. [4] The local points of coexisting compositions, defined by the common tangent construction, are known as a binodal coexistence curve, which denotes the minimum-energy equilibrium state of the system. Increasing temperature results in a decreasing difference between mixing entropy and mixing enthalpy, and thus the coexisting compositions come closer. The binodal curve forms the basis for the miscibility gap in a phase diagram. The free energy of mixing changes with temperature and concentration, and the binodal and spinodal meet at the critical or consolute temperature and composition. [5]

Criterion

For binary solutions, the thermodynamic criterion which defines the spinodal curve is that the second derivative of free energy with respect to density or some composition variable is zero. [3] [6] [7]

Critical point

Extrema of the spinodal in a temperature vs composition plot coincide with those of the binodal curve, and are known as critical points. [7]

Isothermal liquid-liquid equilibria

In the case of ternary isothermal liquid-liquid equilibria, the spinodal curve (obtained from the Hessian matrix) and the corresponding critical point can be used to help the experimental data correlation process. [8] [9] [10]

Related Research Articles

<span class="mw-page-title-main">Phase (matter)</span> Region of uniform physical properties

In the physical sciences, a phase is a region of material that is chemically uniform, physically distinct, and (often) mechanically separable. In a system consisting of ice and water in a glass jar, the ice cubes are one phase, the water is a second phase, and the humid air is a third phase over the ice and water. The glass of the jar is another separate phase.

<span class="mw-page-title-main">Triple point</span> Thermodynamic point where three matter phases exist

In thermodynamics, the triple point of a substance is the temperature and pressure at which the three phases of that substance coexist in thermodynamic equilibrium. It is that temperature and pressure at which the sublimation, fusion, and vaporisation curves meet. For example, the triple point of mercury occurs at a temperature of −38.8 °C (−37.8 °F) and a pressure of 0.165 mPa.

<span class="mw-page-title-main">Phase transition</span> Physical process of transition between basic states of matter

In chemistry, thermodynamics, and other related fields, a phase transition is the physical process of transition between one state of a medium and another. Commonly the term is used to refer to changes among the basic states of matter: solid, liquid, and gas, and in rare cases, plasma. A phase of a thermodynamic system and the states of matter have uniform physical properties. During a phase transition of a given medium, certain properties of the medium change as a result of the change of external conditions, such as temperature or pressure. This can be a discontinuous change; for example, a liquid may become gas upon heating to its boiling point, resulting in an abrupt change in volume. The identification of the external conditions at which a transformation occurs defines the phase transition point.

<span class="mw-page-title-main">Phase diagram</span> Chart used to show conditions at which physical phases of a substance occur

A phase diagram in physical chemistry, engineering, mineralogy, and materials science is a type of chart used to show conditions at which thermodynamically distinct phases occur and coexist at equilibrium.

<span class="mw-page-title-main">Lennard-Jones potential</span> Model of intermolecular interactions

In computational chemistry, molecular physics, and physical chemistry the Lennard-Jones potential is an intermolecular pair potential. Out of all the intermolecular potentials, the Lennard-Jones potential is probably the one that has been the most extensively studied. It is considered an archetype model for simple yet realistic intermolecular interactions.

Thermodynamic equilibrium is an axiomatic concept of thermodynamics. It is an internal state of a single thermodynamic system, or a relation between several thermodynamic systems connected by more or less permeable or impermeable walls. In thermodynamic equilibrium, there are no net macroscopic flows of matter nor of energy within a system or between systems. In a system that is in its own state of internal thermodynamic equilibrium, no macroscopic change occurs.

In thermodynamics, the phase rule is a general principle governing "pVT" systems, whose thermodynamic states are completely described by the variables pressure, volume and temperature, in thermodynamic equilibrium. If F is the number of degrees of freedom, C is the number of components and P is the number of phases, then

In physics, a quantum phase transition (QPT) is a phase transition between different quantum phases. Contrary to classical phase transitions, quantum phase transitions can only be accessed by varying a physical parameter—such as magnetic field or pressure—at absolute zero temperature. The transition describes an abrupt change in the ground state of a many-body system due to its quantum fluctuations. Such a quantum phase transition can be a second-order phase transition. Quantum phase transitions can also be represented by the topological fermion condensation quantum phase transition, see e.g. strongly correlated quantum spin liquid. In case of three dimensional Fermi liquid, this transition transforms the Fermi surface into a Fermi volume. Such a transition can be a first-order phase transition, for it transforms two dimensional structure into three dimensional. As a result, the topological charge of Fermi liquid changes abruptly, since it takes only one of a discrete set of values.

<span class="mw-page-title-main">Critical point (thermodynamics)</span> Temperature and pressure point where phase boundaries disappear

In thermodynamics, a critical point is the end point of a phase equilibrium curve. One example is the liquid–vapor critical point, the end point of the pressure–temperature curve that designates conditions under which a liquid and its vapor can coexist. At higher temperatures, the gas cannot be liquefied by pressure alone. At the critical point, defined by a critical temperatureTc and a critical pressurepc, phase boundaries vanish. Other examples include the liquid–liquid critical points in mixtures, and the ferromagnet–paramagnet transition in the absence of an external magnetic field.

Liquid–liquid extraction (LLE), also known as solvent extraction and partitioning, is a method to separate compounds or metal complexes, based on their relative solubilities in two different immiscible liquids, usually water (polar) and an organic solvent (non-polar). There is a net transfer of one or more species from one liquid into another liquid phase, generally from aqueous to organic. The transfer is driven by chemical potential, i.e. once the transfer is complete, the overall system of chemical components that make up the solutes and the solvents are in a more stable configuration. The solvent that is enriched in solute(s) is called extract. The feed solution that is depleted in solute(s) is called the raffinate. LLE is a basic technique in chemical laboratories, where it is performed using a variety of apparatus, from separatory funnels to countercurrent distribution equipment called as mixer settlers. This type of process is commonly performed after a chemical reaction as part of the work-up, often including an acidic work-up.

In thermodynamics and chemical engineering, the vapor–liquid equilibrium (VLE) describes the distribution of a chemical species between the vapor phase and a liquid phase.

<span class="mw-page-title-main">Spinodal decomposition</span> Mechanism of spontaneous phase separation

Spinodal decomposition is a mechanism by which a single thermodynamic phase spontaneously separates into two phases. Decomposition occurs when there is no thermodynamic barrier to phase separation. As a result, phase separation via decomposition does not require the nucleation events resulting from thermodynamic fluctuations, which normally trigger phase separation.

CALPHAD stands for CALculation of PHAse Diagrams, a methodology introduced in 1970 by Larry Kaufman. An equilibrium phase diagram is usually a diagram with axes for temperature and composition of a chemical system. It shows the regions where substances or solutions are stable and regions where two or more of them coexist. Phase diagrams are a very powerful tool for predicting the state of a system under different conditions and were initially a graphical method to rationalize experimental information on states of equilibrium. In complex systems, computational methods such as CALPHAD are employed to model thermodynamic properties for each phase and simulate multicomponent phase behavior. The CALPHAD approach is based on the fact that a phase diagram is a manifestation of the equilibrium thermodynamic properties of the system, which are the sum of the properties of the individual phases. It is thus possible to calculate a phase diagram by first assessing the thermodynamic properties of all the phases in a system.

<span class="mw-page-title-main">Non-random two-liquid model</span>

The non-random two-liquid model is an activity coefficient model that correlates the activity coefficients of a compound with its mole fractions in the liquid phase concerned. It is frequently applied in the field of chemical engineering to calculate phase equilibria. The concept of NRTL is based on the hypothesis of Wilson that the local concentration around a molecule is different from the bulk concentration. This difference is due to a difference between the interaction energy of the central molecule with the molecules of its own kind and that with the molecules of the other kind . The energy difference also introduces a non-randomness at the local molecular level. The NRTL model belongs to the so-called local-composition models. Other models of this type are the Wilson model, the UNIQUAC model, and the group contribution model UNIFAC. These local-composition models are not thermodynamically consistent for a one-fluid model for a real mixture due to the assumption that the local composition around molecule i is independent of the local composition around molecule j. This assumption is not true, as was shown by Flemr in 1976. However, they are consistent if a hypothetical two-liquid model is used.

<span class="mw-page-title-main">Maxwell construction</span>

In thermodynamic equilibrium, a necessary condition for stability is that pressure, , does not increase with molar volume, ; this is expressed mathematically as , where is the temperature.

<span class="mw-page-title-main">UNIQUAC</span> Model of phase equilibrium in statistical thermodynamics

In statistical thermodynamics, UNIQUAC is an activity coefficient model used in description of phase equilibria. The model is a so-called lattice model and has been derived from a first order approximation of interacting molecule surfaces. The model is, however, not fully thermodynamically consistent due to its two-liquid mixture approach. In this approach the local concentration around one central molecule is assumed to be independent from the local composition around another type of molecule.

<span class="mw-page-title-main">Upper critical solution temperature</span> Critical temperature of miscibility in a mixture

The upper critical solution temperature (UCST) or upper consolute temperature is the critical temperature above which the components of a mixture are miscible in all proportions. The word upper indicates that the UCST is an upper bound to a temperature range of partial miscibility, or miscibility for certain compositions only. For example, hexane-nitrobenzene mixtures have a UCST of 19 °C (66 °F), so that these two substances are miscible in all proportions above 19 °C (66 °F) but not at lower temperatures. Examples at higher temperatures are the aniline-water system at 168 °C (334 °F), and the lead-zinc system at 798 °C (1,468 °F).

<span class="mw-page-title-main">Binodal</span> Graphical curve that denotes a point at which two distinct phases coexist

In thermodynamics, the binodal, also known as the coexistence curve or binodal curve, denotes the condition at which two distinct phases may coexist. Equivalently, it is the boundary between the set of conditions in which it is thermodynamically favorable for the system to be fully mixed and the set of conditions in which it is thermodynamically favorable for it to phase separate. In general, the binodal is defined by the condition at which the chemical potential of all solution components is equal in each phase. The extremum of a binodal curve in temperature coincides with the one of the spinodal curve and is known as a critical point.

<span class="mw-page-title-main">Maxwell's thermodynamic surface</span> Sculpture of a substances thermodynamic properties

Maxwell’s thermodynamic surface is an 1874 sculpture made by Scottish physicist James Clerk Maxwell (1831–1879). This model provides a three-dimensional space of the various states of a fictitious substance with water-like properties. This plot has coordinates volume (x), entropy (y), and energy (z). It was based on the American scientist Josiah Willard Gibbs’ graphical thermodynamics papers of 1873. The model, in Maxwell's words, allowed "the principal features of known substances [to] be represented on a convenient scale."

In thermodynamics, explosive boiling or phase explosion is a method whereby a superheated metastable liquid undergoes an explosive liquid-vapor phase transition into a stable two-phase state because of a massive homogeneous nucleation of vapor bubbles. This concept was pioneered by M. M. Martynyuk in 1976 and then later advanced by Fucke and Seydel.

References

  1. G. Astarita: Thermodynamics: An Advanced Textbook for Chemical Engineers (Springer 1990), chaps 4, 8, 9, 12.
  2. Sandler S. I., Chemical and Engineering Thermodynamics. 1999 John Wiley & Sons, Inc., p 571.
  3. 1 2 3 4 Koningsveld K., Stockmayer W. H., Nies, E., Polymer Phase Diagrams: A Textbook. 2001 Oxford, p 12.
  4. P.H. Mayrhofer et al. Progress in Materials Science 51 (2006) 1032-1114 doi : 10.1016/j.pmatsci.2006.02.002
  5. Cahn RW, Haasen P. Physical metallurgy. 4th ed. Cambridge: Univ Press; 1996
  6. Sandler S. I., Chemical and Engineering Thermodynamics. 1999 John Wiley & Sons, Inc., p 557.
  7. 1 2 Koningsveld K., Stockmayer W. H., Nies, E., Polymer Phase Diagrams: A Textbook. 2001 Oxford, pp 46-47.
  8. Marcilla, A.; Serrano, M.D.; Reyes-Labarta, J.A.; Olaya, M.M. (2012). "Checking Liquid-Liquid Critical Point Conditions and their Application in Ternary Systems". Industrial & Engineering Chemistry Research. 51 (13): 5098–5102. doi:10.1021/ie202793r.
  9. Marcilla, A.; Reyes-Labarta, J.A.; Serrano, M.D.; Olaya, M.M. (2011). "GE Models and Algorithms for Condensed Phase Equilibrium Data Regression in Ternary Systems: Limitations and Proposals". The Open Thermodynamics Journal. 5: 48–62. doi: 10.2174/1874396X01105010048 . hdl: 10045/19865 .
  10. Labarta, Juan A.; Olaya, Maria del Mar; Marcilla, Antonio (2015-11-27). "GMcal_TieLinesLL: Graphical User Interface (GUI) for the Topological Analysis of Calculated GM Surfaces and Curves, including Tie-Lines, Hessian Matrix, Spinodal Curve, Plait Point Location, etc. for Binary and Ternary Liquid -Liquid Equilibrium (LLE) Data". University of Alicante. hdl: 10045/51725 .