Japan Crude Cocktail

Last updated
Japan Crude Cocktail
CountryJapan, South Korea, India, Taiwan, China
Refinery details
Commissioned1950s

The Japan Crude Cocktail (JCC) is the informal nickname given to the pricing index of Crude Oil used in most East Asian countries. [1] The JCC is the average price of customs-cleared crude oil imports into Japan and is published by the Petroleum Association of Japan. [2] The official name of the JCC is the Japan Customs-cleared Crude Oil Price. [3] The valuation of the JCC closely reflects the market state of supply and demand. Clear fluctuations in JCC pricing can be linked to distinct events such as the 2007-08 Global Financial Crisis and the 2011 Fukushima Disaster. [4]

Contents

Sample of Petroleum Petroleum sample.jpg
Sample of Petroleum

The JCC was historically the main index to price Liquified Natural Gas (LNG) contracts as no global benchmark existed. However, as JCC is based on oil prices as opposed to gas, there has been a rise in objection to its use. In Europe and most North American nations, LNG pricing has shifted from use of the JCC to gas-based indexes (e.g. Henry Hub). [3]

Historical Development

Following the end of World War II, Japan's rapid industrialisation made them one of the largest energy consumers. [5] However, Japan's limited domestic resources of fuel means the country relies heavily on imports. In the 1950s, the Japan Crude Cocktail was formulated to create a pricing index of customs-cleared crude oil imports. [1]

The Customs-cleared crude oils applicable have the following Harmonised System codes; 2709.00 100, 2709.00 900, 2710.19 162, 2710.19 164, 2710.19 166, 2710.19 169, 2710.19 172, 2710.19 174, 2710.19.179. [2]

Petroleum Association of Japan

This Petroleum Association of Japan (PAJ) was established in 1955, [6] around the time of the JCC development. The PAJ consists of 11 refiners and primary distributors in Japan. [7] They are responsible for providing central information on the petroleum industry for the public, as well as advocating, researching and enhancing communication among the public and oil companies.

The 11 refiners and primary distributors of the PAJ are Idemitsu Kosan, Cosmo Oil Marketing, TOA Oil, ENEOS, KASHIMA Oil, Kygnus Sekiyu, Taiyo Oil Company, Showa Yokkaichi Sekiyu, Fuji Oil Company, Seibu Oil and Cosmo Oil Company. [8]

The PAJ publish a range of oil statistics monthly on their website, including the JCC.

Users

LNG Contracts

Liquified Natural Gas (LNG) contracts are legal agreements for the sale and purchase of LNG between sellers and buyers [9] LNG is an energy commodity, just like crude oil, allowing for a price relationship between the two. [10]

LNG contract pricing has been based on the JCC index since the 1970s. [11] LNG was initially introduced in Japan as an energy substitute to reduce the country's high dependence on oil. [12] In turn, this guaranteed that gas could remain competitive with oil by having similar pricing. The JCC is used as the pricing index in LNG contracts mainly in Asia Pacific (APAC) and Europe, the Middle East and Africa (EMEA). [2] For example, the index is heavily used in China, South Korea, India, Taiwan. [3]

JCC Formula

JCC

The JCC pricing index is based on the average price of customs-cleared crude oil imports into Japan. The Ministry of Finance sector within the Japanese government publishes the data used to calculate the JCC each month.

$X = The total value of customs cleared crude oil imports

Y = The total volume of customs cleared crude oil imports

LNG Contracts

The JCC figure is then used to generate the price of LNG contracts using the following formula. [13]

PLNG = The Cost, Insurance and Freight (CIF) price of LNG

a = The extent to which the PLNG changes in response to changes in the JCC, also known as the ‘slope’

b = The additional freight charges, discounts or premiums incurred. This constant term is determined through contract negotiations.

Pricing, 1980-2019

The Japan Crude Cocktail prices are given in USD per barrel (USD/bbl). JCC prices are available from the Organisation for Economic Co-operation and Development (OECD). [14]

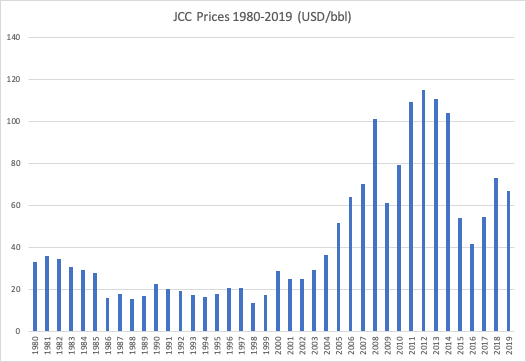
The JCC has had continuous price fluctuations over its history, whilst still steadily increasing. From the raw data and graph, the two major spikes in prices can be seen in 2008 and 2011–12. A comparatively dramatic price low can be observed in 2016. [14]

See also PAJ for month to month pricing Crude Oil Price in Japan.png
See also PAJ for month to month pricing
Price of Crude Oil (JCC) (1980-2019)
YearPrice USD/bbl
198033.11
198135.92
198234.57
198330.47
198429.35
198527.9
198616.08
198717.99
198815.47
198916.91
199022.64
199120.14
199219.3
199317.47
199416.48
199518.02
199620.55
199720.55
199813.68
199917.38
200028.72
200125.01
200224.96
200329.26
200436.59
200551.57
200664.03
200770.09
2008100.98
200961.29
201079.43
2011109.3
2012114.75
2013110.61
2014104.16
201554.2
201641.79
201754.42
201872.85
201966.78

Price Variations

First Oil Crisis 1973

The Yom Kippur War between Israel and Arab nation resulted in the first oil crisis internationally. In October 1973, the Organisation of Petroleum Exporting Countries’ (OPEC) started an oil embargo, targeted at nations thought to be supporting Israel during the conflict. The countries primarily targeted were Japan, US, Canada, UK and the Netherlands. Originally, oil exports from Arab nations were to be reduced by 5% monthly until Israel met the demands of the Arab nations. [15] However, in December, a full embargo was put in place, restricting all trade of oil. Following the events of this first oil crisis, Japan became more aware to their vulnerability to external oil prices and began focusing on increasing their self-dependence on their own natural resources and energy sources. Their whole oil industry was redesigned.

The first oil crisis resulted in recession, inflation and a trade deficit in Japan as all purchasing power was removed from Japan and given to the Arab oil producing nations. [16] In regard to the JCC, the ban on supply heavily increased import prices. Crude oil import prices rose by 300% globally. In 1970, almost 85% of Japan's crude oil imports came from the Middle East. [17]

Global Financial Crisis 2007-2008

The Global Financial Crisis 2007-2008 (GFC) was one of the greatest periods of extreme economic stress since the 1930s. Thousands of businesses suffered heavy losses and/or bankruptcy, with millions of people losing their jobs. The intense period of recession's influential impact on the JCC is highly notable, observed in the first spike seen in 'Crude oil import Prices in Japan 1980-2019' graph.

Worldwide, oil demand heavily relies upon income rather than market demand. [18] When Gross Domestic Product (GDP) is in elevated periods, disposable income is greater, allowing for increased purchase of goods. This creates dependent relationship oil consumption growth rates have with GDP growth rates. It can be observed that in periods of high GDP growth rate, oil consumption growth rates soon also increase. The same can be said for decreases in GDP grow rates.

The period of 2008-2009 saw a decline in both GDP growth rate and oil consumption growth rate in Japan. JCC spiked in 2008 at US$100.98/bbl before dramatically declining in 2009 to $61.29. This aligns with the economic concepts of recession. In times of recession, demand dramatically reduces, driving down prices for suppliers

In the recent years leading to the GFC, China's crude oil imports exponentially increased. With greater economic resources, China began to dominate the consumption of crude oil, reducing crude oil supply available and thus consumption for other nations. From 2005 to 2007, Japan's crude oil consumption per day reduced by 318,000 barrels. [18] Limited supply, drives prices up, reflected in the 2005-2007 JCC increased from US$51.57/bbl to US$70.09/bbl.

Fukushima Disaster 2011

Fukushima Disaster 2011 at Nuclear Power Plant Fukushima I by Digital Globe.jpg
Fukushima Disaster 2011 at Nuclear Power Plant

In March 2011, the Tohoku earthquake and tsunami hit the east coast of Japan. The generators at the Fukushima Nuclear Power plant nearby shut down automatically after detecting the earthquake. [19] The shortly followed tsunami flooded the nuclear power plants, destroying the reactors and releasing radiation. This destruction of the nuclear plant is known as the Fukushima Daiichi Nuclear Disaster. [20]

All 50 reactors were recorded as offline by 2012. One fifth of Japan's energy generating capacity was lost as a result. [21] The loss of domestic energy sources created immense pressure on the Japanese economy as demand for LNG imports rose substantially. [22] In the initial years and immediately after the disaster, LNG imports accounted for 40% of Japan's power. [4] The sudden steep incline in demand rapidly drove prices. From 2010 to 2012, JCC rose from US$79.43/bbl to US$114.75/bbl.

It wasn't until 2015 when some of Japan's nuclear plants were restarted, that JCC prices to return to a lower price.

COVID-19 Pandemic

In 2020, the COVID-19 exponentially infected all parts of the globe, creating an international health outbreak and pandemic. Many nations were sent into lockdown as a result of the health risks. The World Bank stated that the "global economic shock of the COVID-19 pandemic has driven most commodity prices down and is expected to result in substantially lower prices over 2020". [23] This is due to the mass mandatory quarantine that restricted any movement of people, domestically and internationally. Lockdown created a halt in economic activity as people were unable to leave home to attend jobs or to support the economy (e.g. tourism, travel, shopping), [24] [1] affecting both supply and demand. Inability for movement impacted the oil industry heavily as travel restrictions correlate to a cut in demand for jet fuel. [25] The closure of factories and reduced commute amid the crisis further reduced need for fuels.

In Japan, crude oil imports dropped by 25% in 2020, with only 2.28 million barrels per day imported in May 2020. [26] This figure is the lowest it has been in 53 years. This is a direct result of the abrupt freeze of production and supply amid the pandemic. Price of the JCC during the pandemic can be observed in the table generated below. [27] Prices fell to US$24.55/bb in June 2020 as demand for crude oil in Japan dramatically declined.

Price of Crude Oil (JCC) During COVID-19 Pandemic
Month (2020)Price of Crude Oil USD/bb
January70.33
February70.63
March62.16
April42.21
May24.96
June24.55
July32.78
August43.42
September
October
November
December

Future Directions of JCC

Comparison of natural gas prices in Japan (LNG import), Germany (Russian gas at border), and United States Gas prices.svg
Comparison of natural gas prices in Japan (LNG import), Germany (Russian gas at border), and United States

The JCC price index was established in the early 1950s to reflect the market fundamentals of the time. However, as these have shifted over time, the JCC has failed to keep up to date with these changes. [12] After the impacts of the Fukushima Disaster, JCC reached an all-time high of US$114.75/bbl in 2014. Since this event, there has been growing unrest amongst users of the index. [28]

The main concern for users is that JCC is predominately used for pricing LNG contracts. Oil-based LNG contracts are priced considerably higher than alternatives as they reflect the price of oil imports. [28] In European and North American nations, LNG pricing has already shifted from an oil-based pricing index to hub-based pricing such as the Henry Hub and Dutch Title Transfer. However, most East Asian nations continue to use the JCC to price LNG.  cheaper alternative.  In 2014, senior gas analyst at the Institute of Energy Economics, Hiroshi Hashimoto, stated “the aim is to link 100% to Henry Hub prices, rather than JCC as has been the custom globally”. [29]

In addition to the cheaper prices that a gas-based index would offer, the shift would also remove the current time lag between crude oil and LNG prices. The LNG pricing formula in Japan is . (See JCC formula subheading).  JCC prices take on average 5 months to be reflected in LNG contract prices. [30] This is due to the fact that the JCC is derived from the price of crude oil when imported into Japan. However, this figure can greatly change from the international market price on the day of transportation. By shifting to a gas-based pricing index, LNG contracts can be based on current market value, remaining competitive with other indexes.

Related Research Articles

<span class="mw-page-title-main">Economy of Brunei</span>

The economy of Brunei, a small and wealthy country, is a mixture of foreign and domestic entrepreneurship, government regulation and welfare measures, and village traditions. It is almost entirely supported by exports of crude oil and natural gas, with revenues from the petroleum sector accounting for over half of GDP. Per capita GDP is high, and substantial income from overseas investment supplements income from domestic production. The government provides for all medical services and subsidizes food and housing. The government has shown progress in its basic policy of diversifying the economy away from oil and gas. Brunei's leaders are concerned that steadily increased integration in the world economy will undermine internal social cohesion although it has taken steps to become a more prominent player by serving as chairman for the 2000 APEC forum. Growth in 1999 was estimated at 2.5% due to higher oil prices in the second half.

<span class="mw-page-title-main">Liquefied natural gas</span> Form of natural gas for easier storage and transport

Liquefied natural gas (LNG) is natural gas (predominantly methane, CH4, with some mixture of ethane, C2H6) that has been cooled down to liquid form for ease and safety of non-pressurized storage or transport. It takes up about 1/600th the volume of natural gas in the gaseous state at standard conditions for temperature and pressure.

<span class="mw-page-title-main">2000s energy crisis</span> Sixfold rise in oil prices, peaking in 2008

From the mid-1980s to September 2003, the inflation-adjusted price of a barrel of crude oil on NYMEX was generally under US$25/barrel in 2008 dollars. During 2003, the price rose above $30, reached $60 by 11 August 2005, and peaked at $147.30 in July 2008. Commentators attributed these price increases to many factors, including Middle East tension, soaring demand from China, the falling value of the U.S. dollar, reports showing a decline in petroleum reserves, worries over peak oil, and financial speculation.

<span class="mw-page-title-main">Energy in Japan</span> Overview of the production, consumption, import and export of energy and electricity in Japan

Japan is a major consumer of energy, ranking fifth in the world by primary energy use. Fossil fuels accounted for 88% of Japan's primary energy in 2019. Japan imports most of its energy due to scarce domestic resources. As of 2022, the country imports 97% of its oil and is the larger LNG importer globally.

<span class="mw-page-title-main">Price of oil</span> Spot price of a barrel of benchmark crude oil

The price of oil, or the oil price, generally refers to the spot price of a barrel of benchmark crude oil—a reference price for buyers and sellers of crude oil such as West Texas Intermediate (WTI), Brent Crude, Dubai Crude, OPEC Reference Basket, Tapis crude, Bonny Light, Urals oil, Isthmus, and Western Canadian Select (WCS). Oil prices are determined by global supply and demand, rather than any country's domestic production level.

The energy policy of India is to increase the locally produced energy in India and reduce energy poverty, with more focus on developing alternative sources of energy, particularly nuclear, solar and wind energy. Net energy import dependency was 40.9% in 2021-22.

<span class="mw-page-title-main">United States energy independence</span> Idea of eliminating the need for the United States to import foreign sources of energy

United States energy independence is the concept of eliminating or substantially reducing import of petroleum to satisfy the nation's need for energy. Some proposals for achieving energy independence would permit imports from the neighboring nations of Canada and Mexico, in which case it would be called North American energy independence. Energy independence is espoused by those who want to leave the US unaffected by global energy supply disruptions and would restrict reliance upon politically unstable states for its energy security.

<span class="mw-page-title-main">QatarEnergy</span> Qatari state-owned oil company

QatarEnergy, formerly Qatar Petroleum (QP), is a state owned petroleum company of Qatar. The company operates all oil and gas activities in Qatar, including exploration, production, refining, transport, and storage. The President & CEO is Saad Sherida al-Kaabi, Minister of State for Energy Affairs. The company's operations are directly linked with state planning agencies, regulatory authorities, and policy making bodies. Together, revenues from oil and natural gas amount to 60% of the country's GDP. As of 2018 it was the third largest oil company in the world by oil and gas reserves. In 2022, the company had total revenues of US$52bn, a net income of US42.4bn, and total assets of US$162bn. In 2021, QatarEnergy was the fifth largest gas company in the world.

<span class="mw-page-title-main">Petroleum industry in China</span> Overview of the petroleum industry in China

The impact of the petroleum industry has been increasing globally as China ranks seventh for oil production and second in crude oil consumption in the world. China imported a record 6.7 million barrels a day (b/d) of oil in 2015 and was forecast "to overtake the U.S. as the world's biggest crude importer in 2016".

<span class="mw-page-title-main">Petroleum in the United States</span>

Petroleum has been a major industry in the United States since the 1859 Pennsylvania oil rush around Titusville, Pennsylvania. Commonly characterized as "Big Oil", the industry includes exploration, production, refining, transportation, and marketing of oil and natural gas products. The leading crude oil-producing areas in the United States in 2023 were Texas, followed by the offshore federal zone of the Gulf of Mexico, North Dakota and New Mexico.

<span class="mw-page-title-main">Energy in Saudi Arabia</span>

EnergyinSaudi Arabia involves petroleum and natural gas production, consumption, and exports, and electricity production. Saudi Arabia is the world's leading oil producer and exporter. Saudi Arabia's economy is petroleum-based; oil accounts for 90% of the country's exports and nearly 75% of government revenue. The oil industry produces about 45% of Saudi Arabia's gross domestic product, against 40% from the private sector. Saudi Arabia has per capita GDP of $20,700. The economy is still very dependent on oil despite diversification, in particular in the petrochemical sector.

Energy security of the People's Republic of China concerns the need for the People's Republic of China to guarantee itself and its industries long- term access to sufficient energy and raw materials. China has been endeavoring to sign international agreements and secure such supplies; its energy security involves the internal and foreign energy policy of China. Currently, China's energy portfolio consists mainly of domestic coal, oil and gas from domestic and foreign sources, and small quantities of uranium. China has also created a strategic petroleum reserve, to secure emergency supplies of oil for temporary price and supply disruptions. Chinese policy focuses on diversification to reduce oil imports, which used to rely almost exclusively on producers in the Middle East.

<span class="mw-page-title-main">Energy in Egypt</span>

This article describes the energy and electricity production, consumption and import in Egypt.

<span class="mw-page-title-main">Petroleum industry in Iran</span> Overview of the petroleum industry of Iran

Iran is an energy superpower and the petroleum industry in Iran plays an important part in it. In 2004, Iran produced 5.1 percent of the world's total crude oil, which generated revenues of US$25 billion to US$30 billion and was the country's primary source of foreign currency. At 2006 levels of production, oil proceeds represented about 18.7% of gross domestic product (GDP). However, the importance of the hydrocarbon sector to Iran's economy has been far greater. The oil and gas industry has been the engine of economic growth, directly affecting public development projects, the government's annual budget, and most foreign exchange sources.

<span class="mw-page-title-main">Natural gas in China</span> Overview of natural gas use in China

Between 2009 and 2014, gas consumption, production, and imports in China have grown dramatically, with two-digit growth. According to CNPC, the installed capacity of gas-fired power plants in the country is expected to reach around 138 million-154 million kilowatts in 2025, and further grow to 261 million-308 million kilowatts by 2030.

Bangladesh is the sixteenth-largest producer of natural gas in Asia. Gas supplies meet 56% of domestic energy demand. However, the country faces an acute energy crisis in meeting the demands of its vast and growing population. Bangladesh is a net importer of crude oil and petroleum products. The energy sector is dominated by state-owned companies, including Petrobangla and the Bangladesh Petroleum Corporation. Chevron, ConocoPhillips, Equinor, Gazprom and ONGC are major international companies engaged in Bangladesh's hydrocarbon industry, with Chevron's gas fields accounting for 50% of natural gas production.

<span class="mw-page-title-main">Natural gas in the United States</span>

Natural gas was the United States' largest source of energy production in 2016, representing 33 percent of all energy produced in the country. Natural gas has been the largest source of electrical generation in the United States since July 2015.

The petroleum industry in India dates back to 1889 when the first oil deposits in the country were discovered near the town of Digboi in the state of Assam. The natural gas industry in India began in the 1960s with the discovery of gas fields in Assam and Maharashtra. As on 31 March 2018, India had estimated crude oil reserves of 594.49 million metric tonnes (Mt) and natural gas reserves of 1339.57 billion cubic metres of natural gas (BCM).

<span class="mw-page-title-main">Gas in Turkey</span> Production, transport and consumption of gases such as methane in Turkey

Fossil gas supplies over a quarter of Turkey's energy. The country consumes 50 to 60 billion cubic metres of this natural gas each year, nearly all of which is imported. A large gas field in the Black Sea however started production in 2023.

The 2021–2022 global energy crisis has caused varying effects in different parts of the world.

References

  1. 1 2 3 Stern, Jonathon (2020). "A Comparative History of Oil and Gas Markets and Prices: is 2020 just an extreme cyclical event or an acceleration of the energy transition?" (PDF). OIES Energy Insight: 1–22 via University of Oxford.
  2. 1 2 3 CME Group (2020). "FAQ: Japan Crude Cocktail".
  3. 1 2 3 Stern, Jonathon (2014). "Challengest o JCC Pricing in Asian LNG Markets" (PDF). Oxford Institute for Energy Studies.
  4. 1 2 Nikkei (2017). "Japanese LNG prices cool off 6 years after Fukushima". Nikkei.
  5. US Energy Information Administration (2020). "Japan". US Energy Information Administration.
  6. Knoema (2020). "Petroleum Association of Japan". Knoema.
  7. Petroleum Association of Japan (2015). "About PAJ". Petroleum Association of Japan.
  8. Petroleum Association of Japan (2015). "Members of PAJ". Petroleum Association of Japan.
  9. Law Insider (2020). "Definition of LNG Contracts". Law Insider.
  10. Andrew, Hecht (2020). "Crude Oil vs. Natural Gas". The Balance.
  11. Shi, Xungpeng (2016). "Gas and LNG pricing and trading hub in East Asia: An introduction". Natural Gas Industry B. 3 (4): 352–356. Bibcode:2016NGIB....3..352S. doi: 10.1016/j.ngib.2016.12.008 . hdl: 10453/145718 .
  12. 1 2 Xunpeng, Shi (2016). "Gas and LNG Pricing and Trading Hub in East Asia: An introduction". Natural Gas Industry B. 3 (4): 352. Bibcode:2016NGIB....3..352S. doi:10.1016/j.ngib.2016.12.008.
  13. Energy Information Administration (2017). "Perspectives on the Development of LNG Market Hubs in the Asia Pacific Region" (PDF).
  14. 1 2 OECD (2020). "Crude oil import prices". OECD Library.
  15. History (2010). "OPEC enacts oil embargo". History.com.
  16. Marius, Mihut (2012). "First Oil Shock Impact on the Japanese Economy". Procedia Economics and Finance. 3: 1042–1048. doi: 10.1016/S2212-5671(12)00271-7 .
  17. Nippon (2019). "Japan Still Reliant on Middle Eastern Oil". Nipon.com.
  18. 1 2 James, Hamilton (2009). "Causes and Consequences of the Oil Shock of 2007–08" (PDF). Brookings Papers on Economic Activity. 2009: 215–283. doi: 10.1353/eca.0.0047 . S2CID   201760160.
  19. World Nuclear Association (2020). "Fukushima Daiichi Accident". World Nuclear Association.
  20. Lonsdorf, Kat (2020). "How The Fukushima Nuclear Disaster Affected The Energy Industry In Japan". NPR.
  21. Hayashi, Masatsugu (2013). "The Fukushima nuclear accident and its effect on global energy security". Energy Policy. 59: 102–111. Bibcode:2013EnPol..59..102H. doi:10.1016/j.enpol.2012.11.046 via Science Direct.
  22. ADBI Institute (2017). "Impact of Fukushima Nuclear Disaster on Oil-Consuming Sectors of Japan" (PDF).
  23. Felsenthal, Mark (2020). "Most Commodity Prices to Drop in 2020 As Coronavirus Depresses Demand and Disrupts Supply". The World Bank.
  24. PwC (2020). "The possible economic consequences of a novel coronavirus (COVID-19) pandemic" (PDF). PwC.
  25. Sell, Christopher (2020). "How the Pandemic Wiped Out Oil Demand Around the World". Bloomberg Green.
  26. Takeo, Kumagai (2020). "Japan's May crude imports fall to 53-year low as COVID-19 cuts oil demand". S&P Global.
  27. PAJ (2020). "Oil Statistics". Petroleum Association of Japan.
  28. 1 2 Energy Information Administration (2017). "Perspectives on the Development of LNG Market Hubs in the Asia Pacific Region" (PDF). US Energy Information Administration.
  29. MJM Energy (2014). "East meets West - Japan Crude Cocktail and Henry Hub". MZINE.
  30. Koyama, Ken (2015). "Time Lag between Crude Oil and LNG Price Movements" (PDF).