1936 Swedish general election

Last updated

1936 Swedish general election
Flag of Sweden.svg
  1932 20 September 1936 1940  

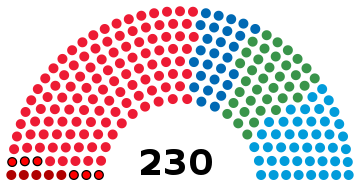
All 230 seats in the Andra kammaren of the Riksdag
116 seats needed for a majority
 First partySecond partyThird party
  Per Albin Hansson, statsminister, portrattbild 1935.jpg Gosta Bagge.jpg Axel Pehrsson-Bramstorp portrait.webp
Leader Per Albin Hansson Gösta Bagge Axel Pehrsson-Bramstorp
Party Social Democrats Electoral League Farmers' League
Last election1045836
Seats won1124436
Seat changeIncrease2.svg8Decrease2.svg14Steady2.svg
Popular vote1,338,120512,781418,840
Percentage45.86%17.57%14.35%

 Fourth partyFifth partySixth party
  Gustaf Andersson i Rasjon.jpg Nils Flyg.jpg Sven Linderot.jpg
Leader Gustaf Andersson Nils Flyg Sven Linderot
Party People's Party Socialist Communist
Last election2462
Seats won2765
Seat changeIncrease2.svg3Steady2.svgIncrease2.svg3
Popular vote376,161127,83296,519
Percentage12.89%4.38%3.31%

Riksdagsvalet 1936.svg
Most voted-for bloc and seats won by constituency

PM before election

Axel Pehrsson-Bramstorp
Centre

Elected PM

Per Albin Hansson
Social Democrats

Party activists for the NSAP handing out ballot papers for their parties outside a polling booth Ballot-distribution-swedish-election-1936.jpg
Party activists for the NSAP handing out ballot papers for their parties outside a polling booth

General elections were held in Sweden on 20 September 1936. [1] The Swedish Social Democratic Party remained the largest party, winning 112 of the 230 seats in the Andra kammaren of the Riksdag. [2] [3]

Results

Sweden Riksdag 1936.svg
PartyVotes%Seats+/–
Swedish Social Democratic Party 1,338,12045.86112+8
General Electoral League 512,78117.5744–14
Farmers' League 418,84014.35360
People's Party 376,16112.8927+3
Socialist Party 127,8324.3860
Communist Party 96,5193.315+3
National League 26,7500.920New
National Socialist Workers' Party 17,4830.600New
Swedish National Socialist Party 3,0250.1000
Centre Party 960.0000
Other parties1460.0100
Total2,917,753100.002300
Valid votes2,917,75399.73
Invalid/blank votes8,0230.27
Total votes2,925,776100.00
Registered voters/turnout3,924,59874.55
Source: Nohlen & Stöver, SCB

References

  1. Dieter Nohlen & Philip Stöver (2010) Elections in Europe: A data handbook, p1858 ISBN   978-3-8329-5609-7
  2. Nohlen & Stöver, p1872
  3. Arneson, Ben A. (1937). "Workers' Parties Show Gains in Sweden and Norway" . American Political Science Review. 31 (1): 97–99. doi:10.2307/1948050. ISSN   0003-0554.