The 2010 Zambian census was conducted in Zambia in 2010 under the approval of the Government of Zambia, which recorded demographic data from 13 million people and 3.2 million households. The 2010 Census of Population and Housing was conducted between 16 October and 15 November 2010, with all parts of the country covered by 30 November 2010. It was the fifth national population census exercise of Zambia since its independence in 1964, with the previous censuses conducted in 1969, 1980, 1990 and 2000. A total of 3.2 million questionnaires were used for data collection and the processing started in April 2011 by the Central Statistical Office. Optical Mark Reading (OMR) and Intelligent Character Recognition (ICR) technology were used for data capture. The census was funded by United Nations Population Fund (UNFPA), the United Kingdom AID (UKAID-formerly DFID), the United States Agency for International Development (USAID) and the African Development Bank (AfDB), who contributed close to 60 per cent of the total expenditure and rest contributed by the Ministry of Finance of the Government of Zambia.
As per the census, Zambia had a total population of 13,092,666 including 6,454,647 males (49.2%) and 6,638,019 females (50.8%) with a sex-ratio of 102.84.[1] The total literacy of the population above the age of five stood at 70.2 per cent.[2] Urban population constituted 39.51 per cent and the remaining 61.49 per cent resided in rural areas. The density of population was 17.4 persons per km2 and the decadal growth of population was 2.8 per cent.[1] There were 22 major languages spoken in Zambia of which 33.5 per cent of the population spoke Bemba, making it the largest spoken language. Out of the seven broad ethnic groups, Bemba was the most prevalent tribal group (21.0%), followed by Tonga (13.6%).[3] The national average of active people stood at 55.5 per cent with 50.2 in rural areas and 65.3 per cent in urban areas. Unemployment rate was 13 per cent as of 2010.[4] Agriculture was the major occupation with 66.5 per cent involved in it.[5] The proportion of people living under poverty line was 60.5 per cent, while the extremely poor formed 42.3 per cent of the total population.
A Post Enumeration Survey (PES) was carried out to find the common issues to be considered into account for future census enumeration activities. The results of the PES indicated that 92.7 per cent of total Zambian residents were captured in the 2010 census, leaving an undercount of 7.3 per cent. The undercount was more in rural areas with an estimated 9.5 per cent of the total population and 3.8 per cent in the urban areas.
Background
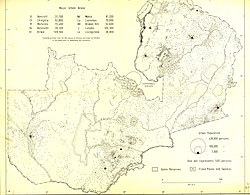
Historical map indicating urbanization in Zambia
The first complete census of Africans in Zambia was carried out in Zambia during May 1963, when the country was a British colony, while the enumeration of non-African people was performed during 1961.[6] Before the 2010 census enumeration, there were four census enumeration exercises carried out in independent Zambia during 1969, 1980, 1990 and 2000.[7] Around 60 per cent of the 2010 census was funded by UNFPA, UKAID (formerly DFID), USAID and AfDB, while the rest was contributed by the Zambian Ministry of Finance.[8] UKAID allocated UK£3 million to the 2010 Zambian census during 2010-13 for financial and technical support.[7]
The second Group Decision Support System (GDDS2)[a] expert mission (a wing of the World Bank) meeting on census enumeration took place during 23 – 27 February 2009, and it published a report with recommendations for the census enumeration. The report suggested using satellite imagery software, having frequent meetings with census steering committees, utilizing time-tested Optical Mark Reading (OMR) process for transferring data from census forms to computer-readable files or newer methods like Optical Character Recognition (OCR), assuring the quality of printing of the census questionnaires, taking Post-enumeration Survey (PES) on time, providing staff training for more in-depth census analysis, changing the population growth rate reporting structure, including measures from the 2007 Demographic and Health Survey (DHS), publishing the census in a medium conducive for general audience, obtaining technical assistance for post-census population projections at the national, provincial and district level, re-projecting HIV prevalence, mortality, and AIDS orphanhood, and establishing a long-term Memorandum of understanding with a technical assistance organization like the US Census Bureau.[9]
Administration
The census enumeration was carried out from 16 October to 15 November 2010 by 25,000 school leavers and 8,400 census supervisors deputed by the Census Statistical Office of Zambia. Civil servants from various government departments trained the enumerators. There were two forms: Form A, which had basic details like full name, sex, membership status, expected to be answered by senior members of each household; Form B which had details about individual members of the family. When the respondent was a minor, proxy members having knowledge about the family were questioned. The details in form B were not sufficiently captured in the forms answered by the proxy members, most of whom did not have full information about all the family members. All buildings that were complete, incomplete, abandoned, habitable or inhabitable were accounted by the enumerators. Compared to the form used during 2000 census enumeration, there were additional details on death of household members, maternal deaths, albinism, orphanhood and fosterhood in the forms used in 2010.[10] The enumeration was completed by 15 November 2010 for majority of the regions, while all the remaining regions of the country were completed by 30 November 2010. A total of 3.2 million questionnaires were used for data collection and the Central Statistical Office started processing the forms from April 2011. OMR and ICR technologies were used for data processing.[8]
Release
Graph indicating population growth in Zambia from 1960 to 2010
The census report of 2010 Zambian census was released during the first week of March 2013 by Fredson Yamba, Secretary to the Treasury of the Government of Zambia. He quoted that “Population is our most valuable resource and we can only take stock of it through an activity like the census. We now have the data, therefore, the challenge remains with all of us to ensure it is put into good use by making informed decisions for our people,”.[11]United Nations Children's Fund (UNICEF) helped the Government of Zambia, especially the Child Welfare Ministry to update the data from the Living Condition Monitoring Survey (LCMS) and data on all key performance indicators of the National Development Plan (ZNDP) during 2013.[12]
The Government of Zambia also initiated the Central Statistics Office to review the census of 2010 to determine the eligible voters for the proposed referendum in 2016.[13]
Reports
Zambia had a total population of 13,092,666 including 6,454,647 males and 6,638,019 females. Among the provinces, Lusaka had the largest population followed by Copperbelt, Eastern, Southern and Central. The interdecadal growth was 2.8 per cent compared to 2.5 per cent during the census of 2000.[14]
The proportion of people living under poverty line was 60.5 per cent in 2010 compared to 62.8 per cent in 2006 as per the Living Condition Monitoring Survey (LCMS). The extremely poor formed 42.3 per cent of the total population as against 42.7 per cent in 2007.[10] Around two per cent of the population was disabled, 35 per cent of which is accounted to diseases. Out of the disabled, 90.2 per cent were employed and the literacy rate of the disabled population remained at 58.6 per cent compared to the general literacy rate of 70.2 per cent.[16]Albinism is a condition where people have little or no pigment in their eyes, skin or hair. As per the census, there were 25,324 albino people in the country with 12,532 males (49.48%) and 12,792 females (50.52%). The literacy rate of albino population was 66.1 per cent.[17]
Population distribution in Zambia by states yearly comparison[18]
Western Province was the largest among all provinces, having an area of 126,386km2, while Lusaka was the smallest with 21,896km2.[19] Lusaka was the most populated and the most densely populated with a population of 2,191,225 and a density of 100 persons per km2.[20] As of 2010, Western Province had the best sex ratio of 108 females for every 100 males,[21] while Copperbelt had the lowest of 101.[22]Northern Province had the highest number of basic schools,[23] while Copperbelt had the highest number of high schools.[22] The unemployment rate of youth (55%) and general unemployment rate (32%) was the highest in Copperbelt Province,[22] while Eastern had the lowest unemployment rate of 6 per cent. AIDS death was maximum in Copperbelt with 26,799 recorded deaths in 2010,[22] while it was lowest in North-Western with 2,859 recorded deaths.[24] Lusaka Province had the most doctors and fewest Malaria related incidents, while North-Western had the lowest number of doctors.[24]
Christianity is the official religion in Zambia according to the Constitution of Zambia.[29]Christians belonging to various denominations formed a majority, while many other religious traditions were also present in the country. In 2010, according to World Christian Trends, 85.5 per cent of the population were identified as Christian, 11.2 per cent with indigenous religions, 1.8 per cent as Bahá'í, 1.1 per cent as Muslim, 0.2 per cent as agnostic, 0.1 per cent as Hindu, and all other groups accounted for less than 0.1 per cent.[30] The 2010 Zambian census found that 75.3 per cent of Zambians were Protestant, 20.2 per cent were Catholic, 0.5 per cent were Muslim, 2.0 per cent followed other religions, and 1.8 per cent had no religion.[31]
Bemba was the most widely spoken language in both urban and rural Zambia with a total of 33.5 per cent speaking it, followed by Nyanja spoken by 14.8 per cent of the total population. At a national level, Toka-Leya remained the least spoken language with 0.5 per cent, but English remained the least spoken language in rural areas with only 0.2 per cent using it.[32]
Population distribution in Zambia by states yearly comparison
According to the census of 2010, Bemba was the most populous tribal community forming 21 per cent of the total population, followed by Tonga, who formed 13.6 per cent of the total population. Chokwe were the smallest community forming 0.5 per cent of the total population. In rural areas, Tonga was the major community with 16.8 per cent while in urban areas it was Bemba, who formed 28.5 per cent of the total population.[33]
As of 2010, people who were aged 12 years and above involved in a profession were classified as economically active,[d] while housewives, homemakers, students, aged and non-working people were classified as inactive. Western had 63.8 per cent of active population, making it the province with the highest proportion of working people. Lusaka had the most active people (703,097), while Muchinga Province had the fewest (150,267). Lusaka also had the most working women, while North-Western had the fewest working women. The national average of active people stood at 55.5 per cent with 50.2 in rural areas and 65.3 per cent in urban areas.[33] The unemployment rate was 13.0 per cent during 2010, with Copperbelt Province having the highest rate of 22.1 per cent and Northern Province had the least rate of 13.0 per cent.[34] The youth unemployment, defined as unemployed rate of people aged 15–35 years, stood at 16.7 per cent, with the age group of 20-24 constituting 23.5 per cent.[35]
Population distribution by profession
Profession
Total
Male
Female
Rural
Urban
Manager
0.9
1.2
0.6
0.3
2.2
Skilled agricultural forestry and fishery workers
53.8
48.9
59.9
74.4
10.7
Elementary occupations
12.8
12.2
13.5
13.2
8.4
Craft and related trades workers
6.9
10.5
2.4
2.6
15.8
Service and sales workers
10.0
9.1
11.1
2.1
26.5
Plant and machine operators and assemblers
3.2
5.4
0.5
0.7
8.4
Professionals
4.6
4.8
4.2
1.8
10.5
Technicians and associate professionals
2.2
2.7
1.5
0.7
5.4
Clerical support workers
1.0
0.8
1.2
0.1
2.7
Not Stated
4.7
4.4
5.1
4.2
5.9
As of 2010, agriculture was the major profession in most of the provinces in Zambia. Maize, mixed beans, rice, sorghum, soya beans, sunflower, sweet potatoes and wheat were the major crops in the provinces. Among all provinces, Central had the maximum area, 391,593.23ha (967,647.9 acres), constituting 20.64 per cent, while Luapula had the smallest area at 3.06 per cent of the total area. Maize production was maximum in Eastern (22.5%), mixed beans (51.66%) in Northern, sorghum in Southern (40.62%), sunflower in Eastern (70.2%), soya beans (45.06%), sweet potatoes (28.5%) and wheat (49.51%) in Central Province.[36]
As per the census, Zambia recorded a Total fertility rate (TFR), defined as the fertility rate of a woman throughout her life, of 5.9, with 7.0 in rural and 4.6 in urban areas. The most urbanized provinces, with higher socio-economic index like Lusaka recorded a lower TFR. Crude birth rate (CBR), the number of live births for each 1,000 births, stood at 35 in Zambia, with the Northern Province recording a maximum of 41. Child-woman ratio (CWR), the ratio of children aged 0–4 against women aged 15–49, was 738 children per thousand women and it was maximum in Northern province, where it was 880. The General fertility rate (GFR), the number of births per 1,000 child-bearing women, was 147 as per the census. The Completed family Size (CF) was 6.4 in rural areas and 5.4 in urban areas. Gross reproduction rate (GRR), the average number of females births a woman would have between ages 15–49, was 2.3, while the Net reproduction rate (NRR), the number of surviving female births a woman would have between ages 15–49, stood at 2.1.[37]
A study published in Population Health Metrics indicated that the census reported very high adult female mortality, particularly a high pregnancy-related mortality in both rural and urban areas twelve months prior to the census. The evaluation of population age, age-at-death, live births were reported to contain data errors.[38] Another study by Demographic Research indicated that the data of people aged above 80 was not accurately captured in most sub-Saharan countries, which prevented research on age-related health ailments and other socio-economic characteristics.[39]
Post Enumeration Survey
A Post-Enumeration Census (PES) was carried out three months after the completion of census enumeration in 2010. It was carried out with the help of African Development Bank, US Census Bureau and United Nations Population Fund (UNFPA).[40] The sample data chosen for the PES from the census of 1990 was based on the guidelines of United Nations Statistics Division. It accounted socio-demographic variability based on rural and urban population and having a proportional sample size for the PES. Majority of provinces of Zambia being rural, the survey had a higher sample size in rural areas.[41] It was the first time when the PES results were fully analyzed in Zambia compared to previous years when they were only partially analyzed. The PES was aimed at finding the common issues to be considered for future census enumeration activities.[42] PES was applied in every stage of sample design, enumeration, matching, reconciliation and the application of Dual System Estimation methodology. The major recommendations from PES were to have a pilot PES, have effective sample design and data collection of PES, match data between PES and actual enumeration by having correct names of respondents, computerize matching and include cell phone and telephone number of the respondents.[43] The results of the PES indicated that 92.7 per cent of total Zambian residents were captured in the 2010 census, leaving an under count of 7.3 per cent. The estimated under count was 9.5 per cent of the total population in rural areas and 3.8 per cent in the urban areas.[42]
^ GDDS denotes Group Decision Support System, a technology implemented in the same place or time across multiple entities for brainstorming purposes.[citation needed]
^ Muchinga Province was created post the elections during September 2011.[8]
^Chinsali, Isoka, Mpika and Nakonde, the districts of Northern Province and Chama, a district in Eastern Province were moved to the newly created Muchinga Province in 2011. There were no changes in district boundaries and the population details of the districts were directly considered for Muchinga Province without the need for approximations.[8]
^ Economically active people form both the employed (working for pay, profit or gain; on leave; unpaid family worker) and unemployed (unemployed & seeking employment; not seeking work, but available for work).[4]
^ Any person who is able to read or write in any language is considered literate.[2]
↑Post Enumeration Surveys Operational guidelines(PDF) (Report). New York: Statistics Division, Department of Economic and Social Affairs, United Nations Secretariat. 2010. p.40. Retrieved 31 October 2016.
This page is based on this Wikipedia article Text is available under the CC BY-SA 4.0 license; additional terms may apply. Images, videos and audio are available under their respective licenses.