Ballerup (nomination district)

Last updated
Ballerup
Ballerup
Nomination district constituency
for the Folketing
Ballerup Opstillingskreds.svg
Location of Ballerup within Greater Copenhagen
Kobenhavn Omegns Storkreds.svg
Location of Greater Copenhagen within Denmark
Municipalities Ballerup
Glostrup
Constituency Greater Copenhagen
Electorate46,519 (2022) [1]
Current constituency
Created1970 [2]

Ballerup nominating district is one of the 92 nominating districts that was created for Danish elections following the 2007 municipal reform. [3] [4] [5] It consists of Ballerup and Glostrup municipality. [6] It was created in 1970, [7] though its boundaries have been changed since then.

Contents

In general elections, the district is a strong area for parties commonly associated with the red bloc. [8]

General elections results


General elections in the 2020s

2022 Danish general election

PartiesVote
Votes %+ / -
Social Democrats 14,16434.62+2.36
Moderates 4,0629.93New
Venstre 3,8859.49-7.15
Green Left 3,7639.20+0.03
Liberal Alliance 2,7456.71+4.45
Conservatives 1,8894.62-1.15
Denmark Democrats 1,8824.60New
Red–Green Alliance 1,8584.54-2.04
Danish People's Party 1,8134.43-6.16
Social Liberals 1,4843.63-3.92
New Right 1,3673.34+0.85
The Alternative 1,0932.67+0.28
Independent Greens 6971.70New
Christian Democrats 1600.39-0.68
Jovan Tasevski460.11New
Henrik Vendelbo Petersen90.02New
Total40,917
Source [9]

General elections in the 2010s

2019 Danish general election

PartiesVote
Votes %+ / -
Social Democrats 13,52932.26-2.01
Venstre 6,97716.64+2.75
Danish People's Party 4,44110.59-13.49
Green Left 3,8449.17+4.97
Social Liberals 3,1657.55+4.09
Red–Green Alliance 2,7596.58-1.02
Conservatives 2,4225.77+3.42
New Right 1,0442.49New
The Alternative 1,0032.39-1.13
Liberal Alliance 9462.26-3.73
Stram Kurs 9132.18New
Christian Democrats 4501.07+0.55
Klaus Riskær Pedersen Party 3270.78New
Mads Palsvig1080.26New
Christian B. Olesen130.03New
Total41,941
Source [10]

2015 Danish general election

PartiesVote
Votes %+ / -
Social Democrats 14,69634.27+2.49
Danish People's Party 10,32624.08+9.01
Venstre 5,95513.89-6.57
Red–Green Alliance 3,2607.60+0.84
Liberal Alliance 2,5705.99+1.75
Green Left 1,8014.20-4.16
The Alternative 1,5093.52New
Social Liberals 1,4843.46-4.77
Conservatives 1,0082.35-2.27
Christian Democrats 2230.52+0.16
Asif Ahmad370.09New
Christian Olesen120.03New
Total42,881
Source [11]

2011 Danish general election

PartiesVote
Votes %+ / -
Social Democrats 13,91931.78-2.90
Venstre 8,95920.46+2.56
Danish People's Party 6,59915.07-1.77
Green Left 3,6618.36-3.96
Social Liberals 3,6068.23+4.38
Red–Green Alliance 2,9626.76+4.87
Conservatives 2,0244.62-4.98
Liberal Alliance 1,8584.24+1.75
Christian Democrats 1560.36-0.04
Christian H. Hansen510.12New
Total43,795
Source [12]

General elections in the 2000s

2007 Danish general election

PartiesVote
Votes %+ / -
Social Democrats 14,93334.68+6.23
Venstre 7,70917.90-5.83
Danish People's Party 7,25216.84+2.45
Green Left 5,30412.32+6.01
Conservatives 4,1359.60-3.02
Social Liberals 1,6593.85-5.13
New Alliance 1,0742.49New
Red–Green Alliance 8131.89-1.29
Christian Democrats 1730.40-0.64
Janus Kramer Møller40.01New
Feride Istogu Gillesberg10.00New
Total43,057
Source [13]

2005 Danish general election

PartiesVote
Votes %+ / -
Social Democrats 13,64528.45-2.15
Venstre 11,38123.73-4.50
Danish People's Party 6,90514.39+0.80
Conservatives 6,05212.62+4.17
Social Liberals 4,3078.98+3.64
Green Left 3,0286.31-0.79
Red–Green Alliance 1,5253.18+0.75
Centre Democrats 5301.10-1.32
Christian Democrats 5011.04-0.56
Minority Party 830.17New
Nahid Yazdanyar120.03New
Total47,969
Source [14]

2001 Danish general election

PartiesVote
Votes %+ / -
Social Democrats 15,03330.60-5.48
Venstre 13,86728.23+8.89
Danish People's Party 6,67413.59+3.93
Conservatives 4,1498.45-1.22
Green Left 3,4867.10-2.40
Social Liberals 2,6255.34+1.36
Red–Green Alliance 1,1962.43-0.16
Centre Democrats 1,1892.42-3.58
Christian People's Party 7861.60+0.25
Progress Party 1180.24-1.07
Total49,123
Source [15]

General elections in the 1990s

1998 Danish general election

PartiesVote
Votes %+ / -
Social Democrats 17,32736.08+1.65
Venstre 9,29019.34+2.64
Conservatives 4,6439.67-8.89
Danish People's Party 4,6419.66New
Green Left 4,5629.50-0.08
Centre Democrats 2,8796.00+1.47
Social Liberals 1,9113.98-1.22
Red–Green Alliance 1,2442.59-0.85
Christian People's Party 6481.35+0.41
Progress Party 6281.31-4.01
Democratic Renewal1310.27New
Mogens Glistrup1140.24-0.22
Poul Bregninge30.01New
Anders Kofoed20.00New
Total48,023
Source [16]

1994 Danish general election

PartiesVote
Votes %+ / -
Social Democrats 16,26234.43-3.85
Conservatives 8,76818.56-0.15
Venstre 7,89016.70+6.49
Green Left 4,5279.58-0.53
Progress Party 2,5135.32+1.43
Social Liberals 2,4575.20+0.78
Centre Democrats 2,1424.53-3.20
Red–Green Alliance 1,6243.44+1.53
Christian People's Party 4450.94-0.06
Niels I. Meyer2460.52New
Mogens Glistrup2180.46New
Preben Møller Hansen1310.28New
Torben Faber80.02New
John Ziegler70.01New
Total47,238
Source [17]

1990 Danish general election

PartiesVote
Votes %+ / -
Social Democrats 17,55538.28+7.57
Conservatives 8,58118.71-2.12
Venstre 4,68010.21+4.70
Green Left 4,63710.11-6.27
Centre Democrats 3,5457.73+0.95
Social Liberals 2,0264.42-2.47
Progress Party 1,7833.89-2.77
Common Course 1,0422.27+0.35
Red–Green Alliance 8741.91New
Christian People's Party 4571.00+0.15
The Greens 4010.87-0.89
Justice Party of Denmark 2600.57New
Humanist Party 150.03New
Total45,856
Source [18]

General elections in the 1980s

1988 Danish general election

PartiesVote
Votes %+ / -
Social Democrats 14,47330.71+1.22
Conservatives 9,82020.83-0.86
Green Left 7,72316.38-2.14
Social Liberals 3,2466.89-1.09
Centre Democrats 3,1946.78-0.06
Progress Party 3,1386.66+3.31
Venstre 2,5975.51+1.84
Common Course 9071.92-0.27
The Greens 8301.760.00
Communist Party of Denmark 5241.11-0.02
Christian People's Party 4030.85-0.25
Left Socialists 2740.58-0.75
Leif Hilt60.01New
Total47,135
Source [19]

1987 Danish general election

PartiesVote
Votes %+ / -
Social Democrats 14,11329.49-3.24
Conservatives 10,38021.69-1.98
Green Left 8,86518.52+2.69
Social Liberals 3,8207.98+1.14
Centre Democrats 3,2736.84+1.37
Venstre 1,7543.67-1.70
Progress Party 1,6043.35+0.50
Common Course 1,0492.19New
The Greens 8421.76New
Left Socialists 6371.33-1.89
Communist Party of Denmark 5401.13+0.17
Christian People's Party 5271.10+0.05
Justice Party of Denmark 2770.58-1.26
Humanist Party 1350.28New
Socialist Workers Party 280.06-0.05
Marxist–Leninists Party 100.02-0.02
Carsten Grøn-Nielsen30.010.00
Per Hillersborg10.00New
Total47,858
Source [20]

1984 Danish general election

PartiesVote
Votes %+ / -
Social Democrats 15,67332.73-0.09
Conservatives 11,33223.67+7.90
Green Left 7,57815.83+0.05
Social Liberals 3,2766.84+0.20
Centre Democrats 2,6195.47-3.97
Venstre 2,5715.37+1.17
Left Socialists 1,5443.22-0.68
Progress Party 1,3672.85-4.17
Justice Party of Denmark 8791.84-0.01
Christian People's Party 5031.05+0.33
Communist Party of Denmark 4580.96-0.61
Socialist Workers Party 550.11+0.02
Marxist–Leninists Party 210.04New
Carsten Grøn-Nielsen50.01New
Mogens Nebelong20.00-0.01
Poul Rasmussen00.00New
Total47,883
Source [21]

1981 Danish general election

PartiesVote
Votes %+ / -
Social Democrats 14,58232.82-6.59
Green Left 7,01115.78+7.25
Conservatives 7,00815.77+1.99
Centre Democrats 4,1939.44+5.75
Progress Party 3,1217.02-1.28
Social Liberals 2,9526.64-0.42
Venstre 1,8674.20-1.76
Left Socialists 1,7353.90-1.73
Justice Party of Denmark 8241.85-1.64
Communist Party of Denmark 6991.57-1.05
Christian People's Party 3200.72-0.18
Communist Workers Party 810.18-0.45
Socialist Workers Party 400.09New
Mogens Nebelong30.01New
Total44,436
Source [22]

General elections in the 1970s

1979 Danish general election

PartiesVote
Votes %+ / -
Social Democrats 17,33239.41-0.15
Conservatives 6,05813.78+5.40
Green Left 3,7528.53+2.13
Progress Party 3,6528.30-3.83
Social Liberals 3,1057.06+3.65
Venstre 2,6215.96+0.96
Left Socialists 2,4785.63+1.50
Centre Democrats 1,6213.69-5.65
Justice Party of Denmark 1,5353.49-0.96
Communist Party of Denmark 1,1542.62-2.71
Christian People's Party 3940.90-0.47
Communist Workers Party 2760.63New
Total43,978
Source [23]

1977 Danish general election

PartiesVote
Votes %+ / -
Social Democrats 16,84439.56+10.23
Progress Party 5,16512.13-1.50
Centre Democrats 3,9789.34+5.93
Conservatives 3,5678.38+2.34
Green Left 2,7276.40-3.05
Communist Party of Denmark 2,2705.33-0.95
Venstre 2,1305.00-10.89
Justice Party of Denmark 1,8944.45+2.04
Left Socialists 1,7574.13+1.17
Social Liberals 1,4523.41-4.18
Christian People's Party 5831.37-1.59
Pensioners' Party 2090.49New
Poul Rasmussen10.00New
Otto Jensen00.00New
Total42,577
Source [24]

1975 Danish general election

PartiesVote
Votes %+ / -
Social Democrats 11,99429.33+6.70
Venstre 6,49815.89+9.63
Progress Party 5,57413.63-1.40
Green Left 3,8649.45-1.13
Social Liberals 3,1037.59-1.82
Communist Party of Denmark 2,5666.28+1.01
Conservatives 2,4696.04-3.75
Centre Democrats 1,3963.41-9.93
Left Socialists 1,2102.96+0.63
Christian People's Party 1,2092.96+1.14
Justice Party of Denmark 9862.41-1.13
J. G. Amdrejcak100.02New
Kai Clemmensen40.01New
Henning Glahn30.01New
Poul Friborg10.00New
Total40,887
Source [25]

1973 Danish general election

PartiesVote
Votes %+ / -
Social Democrats 9,40622.63-13.88
Progress Party 6,24815.03New
Centre Democrats 5,54513.34New
Green Left 4,39910.58-4.44
Conservatives 4,0689.79-10.85
Social Liberals 3,9109.41-4.17
Venstre 2,6036.26-0.54
Communist Party of Denmark 2,1915.27+2.96
Justice Party of Denmark 1,4713.54+1.95
Left Socialists 9682.33-0.19
Christian People's Party 7551.82+1.09
Erik Dissing80.02New
Total41,572
Source [26]

1971 Danish general election

PartiesVote
Votes %+ / -
Social Democrats 13,87236.51
Conservatives 7,84220.64
Green Left 5,70715.02
Social Liberals 5,16113.58
Venstre 2,5846.80
Left Socialists 9582.52
Communist Party of Denmark 8762.31
Justice Party of Denmark 6041.59
Christian People's Party 2790.73
Henning Berthelsen1150.30
Total37,998
Source [27]

European Parliament elections results

2024 European Parliament election in Denmark

PartiesVote
Votes %+ / -
Social Democrats 5,55920.1-6.91
Green Left 5,16718.69+5.27
Venstre 3,04911.03-5.54
Conservatives 2,4558.88+3.36
Danish People's Party 2,2468.12-4.60
Red–Green Alliance 2,0027.24+1.45
Social Liberals 1,8606.73-2.77
Moderates 1,7286.25New
Liberal Alliance 1,7196.22+4.44
Denmark Democrats 1,0533.81New
The Alternative 8142.94+0.24
Total27,652
Source [28]

2019 European Parliament election in Denmark

PartiesVote
Votes %+ / -
Social Democrats 8,70327.01+3.97
Venstre 5,33816.57+5.47
Green Left 4,32413.42+3.43
Danish People's Party 4,09912.72-19.37
Social Liberals 3,0619.50+3.88
Red–Green Alliance 1,8675.79New
Conservatives 1,7795.52-1.33
People's Movement against the EU 1,6084.99-3.97
The Alternative 8702.70New
Liberal Alliance 5751.78-0.57
Total32,224
Source [29]

2014 European Parliament election in Denmark

PartiesVote
Votes %+ / -
Danish People's Party 9,34632.09+12.48
Social Democrats 6,70923.04-1.64
Venstre 3,23411.10-2.40
Green Left 2,9109.99-6.47
People's Movement against the EU 2,6088.96-0.54
Conservatives 1,9946.85-2.82
Social Liberals 1,6385.62+2.16
Liberal Alliance 6842.35+1.83
Total29,123
Source [30]

2009 European Parliament election in Denmark

PartiesVote
Votes %+ / -
Social Democrats 7,22124.68-7.41
Danish People's Party 5,73619.61+12.14
Green Left 4,81516.46+6.80
Venstre 3,94813.50+0.27
Conservatives 2,8289.67-4.94
People's Movement against the EU 2,7809.50+3.45
Social Liberals 1,0123.46-3.48
June Movement 7622.60-6.71
Liberal Alliance 1520.52New
Total29,254
Source [31]

2004 European Parliament election in Denmark

PartiesVote
Votes %+ / -
Social Democrats 9,46432.09+16.03
Conservatives 4,30814.61+5.32
Venstre 3,90313.23-4.88
Green Left 2,8489.66+1.05
June Movement 2,7479.31-8.39
Danish People's Party 2,2037.47+0.65
Social Liberals 2,0466.94-3.01
People's Movement against the EU 1,7856.05-2.19
Christian Democrats 1920.65-0.51
Total29,496
Source [32]

1999 European Parliament election in Denmark

PartiesVote
Votes %+ / -
Venstre 5,47718.11+5.58
June Movement 5,35217.70+0.26
Social Democrats 4,85516.06+0.92
Social Liberals 3,0099.95-0.09
Conservatives 2,8099.29-9.59
Green Left 2,6038.61-2.44
People's Movement against the EU 2,4908.24-2.75
Danish People's Party 2,0636.82New
Centre Democrats 1,2264.05+3.02
Christian Democrats 3521.16+0.70
Progress Party 1210.40-2.05
Total30,236
Source [33]

1994 European Parliament election in Denmark

PartiesVote
Votes %+ / -
Conservatives 5,93018.88+5.42
June Movement 5,47817.44New
Social Democrats 4,75515.14-7.30
Venstre 3,93712.53+1.47
Green Left 3,47111.05-0.21
People's Movement against the EU 3,45310.99-14.17
Social Liberals 3,15510.04+7.28
Progress Party 7692.45-1.06
Centre Democrats 3241.03-8.00
Christian Democrats 1450.46-0.84
Total31,417
Source [34]

1989 European Parliament election in Denmark

PartiesVote
Votes %+ / -
People's Movement against the EU 6,79025.16-2.43
Social Democrats 6,05622.44+3.52
Conservatives 3,63313.46-7.61
Green Left 3,03911.26-2.46
Venstre 2,98511.06+7.24
Centre Democrats 2,4369.03+2.50
Progress Party 9473.51+0.78
Social Liberals 7452.76-0.27
Christian Democrats 3521.300.00
Total26,983
Source [35]

1984 European Parliament election in Denmark

PartiesVote
Votes %
People's Movement against the EU 8,24127.59
Conservatives 6,29221.07
Social Democrats 5,64918.92
Green Left 4,09613.72
Centre Democrats 1,9516.53
Venstre 1,1413.82
Social Liberals 9043.03
Progress Party 8142.73
Left Socialists 3891.30
Christian Democrats 3881.30
Total29,865
Source [36]

Referendums

2022 Danish European Union opt-out referendum [37]

OptionVotes %
✓ YES20,81464.47
X NO11,47135.53

2015 Danish European Union opt-out referendum [38]

OptionVotes %
X NO20,67857.59
✓ YES15,22742.41

2014 Danish Unified Patent Court membership referendum [39]

OptionVotes %
✓ YES16,33057.15
X NO12,24242.85

2009 Danish Act of Succession referendum [40]

OptionVotes %
✓ YES21,13582.55
X NO4,46817.45

2000 Danish euro referendum [41]

OptionVotes %
X NO25,79953.02
✓ YES22,86446.98

1998 Danish Amsterdam Treaty referendum [42]

OptionVotes %
✓ YES23,35153.48
X NO20,31246.52

1993 Danish Maastricht Treaty referendum [43]

OptionVotes %
✓ YES26,43954.17
X NO22,36745.83

1992 Danish Maastricht Treaty referendum [44]

OptionVotes %
X NO25,13352.76
✓ YES22,50047.24

1986 Danish Single European Act referendum [45]

OptionVotes %
X NO22,72153.70
✓ YES19,58846.30

1972 Danish European Communities membership referendum [46]

OptionVotes %
✓ YES21,95053.17
X NO19,33046.83

Related Research Articles

<span class="mw-page-title-main">Skive (nomination district)</span> Nominating district in Denmark

Skive nominating district is one of the 92 nominating districts that exists for Danish elections following the 2007 municipal reform. It consists of Skive municipality. It was created in 1849 as a constituency, and has been a nomination district since 1920, though its boundaries have been changed since then.

<span class="mw-page-title-main">Aarhus West (nomination district)</span>

Aarhus West nominating district is one of the 92 nominating districts that exists for Danish elections following the 2007 municipal reform. It is one of the four nomination districts in Aarhus Municipality, the others being Aarhus South, Aarhus North and Aarhus East. It was created in 1970, with its boundaries being slightly changed in 2007.

<span class="mw-page-title-main">Aarhus East (nomination district)</span>

Aarhus East nominating district is one of the 92 nominating districts that exists for Danish elections following the 2007 municipal reform. It is one of the four nomination districts in Aarhus Municipality, the others being Aarhus South, Aarhus West and Aarhus North. It was created in 1970, with its boundaries being slightly changed in 2007.
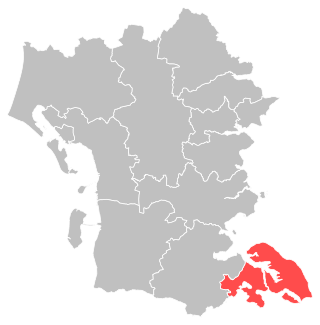
<span class="mw-page-title-main">Sønderborg (nomination district)</span>

Sønderborg nominating district is one of the 92 nominating districts that exists for Danish elections following the 2007 municipal reform. It consists of Sønderborg municipality. It was created in 1920 following its reunification with Denmark, though its boundaries have been changed since then.
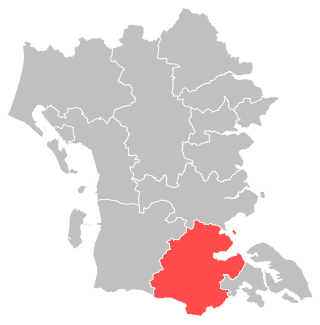
<span class="mw-page-title-main">Aabenraa (nomination district)</span> Nominating district for Danish elections

Aabenraa nominating district is one of the 92 nominating districts that exists for Danish elections following the 2007 municipal reform. It consists of Aabenraa Municipality. It was created in 1920 following its reunification with Denmark, though its boundaries have been changed since then.

<span class="mw-page-title-main">Odense East (nomination district)</span>

Odense East nominating district is one of the 92 nominating districts that exists for Danish elections following the 2007 municipal reform. It is one of the three nomination districts in Odense Municipality, the others being Odense West and Odense South. It was created in 1970 and has maintained its boundaries since then.

<span class="mw-page-title-main">Odense West (nomination district)</span>

Odense West nominating district is one of the 92 nominating districts that exists for Danish elections following the 2007 municipal reform. It is one of the three nomination districts in Odense Municipality, the others being Odense East and Odense South. It was created in 1970 and has maintained its boundaries since then.
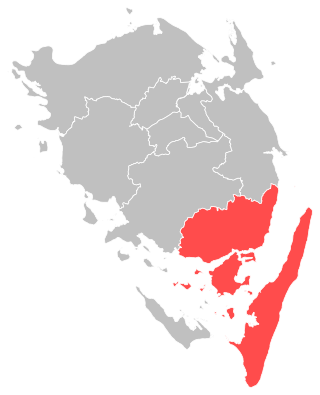
<span class="mw-page-title-main">Svendborg (nomination district)</span>

Svendborg nominating district is one of the 92 nominating districts that exists for Danish elections following the 2007 municipal reform. It consists of Langeland and Svendborg municipality. It was created in 1849 as a constituency, and has been a nomination district since 1920, though its boundaries have been changed since then.

<span class="mw-page-title-main">Kalundborg (nomination district)</span>

Kalundborg nominating district is one of the 92 nominating districts that exists for Danish elections following the 2007 municipal reform. It consists of Kalundborg and Odsherred municipality. It was created in 1849 as a constituency, and has been a nomination district since 1920, though its boundaries have been changed since then. Prior to 1970 it was known as Kalundborg-Onsbjerg.

<span class="mw-page-title-main">Gentofte (nomination district)</span>

Gentofte nominating district is one of the 92 nominating districts that exists for Danish elections following the 2007 municipal reform. It consists of Gentofte Municipality. It was created in 1915 with its current boundary, though from 1950 to 2007 the other half of the municipality was part of a separate Hellerup nomination district.

<span class="mw-page-title-main">Gladsaxe (nomination district)</span>

Gladsaxe nominating district is one of the 92 nominating districts that exists for Danish elections following the 2007 municipal reform. It consists of Gladsaxe Municipality. It was created in 1950, though its boundaries have been changed since then.

<span class="mw-page-title-main">Rødovre (nomination district)</span>

Rødovre nominating district is one of the 92 nominating districts that exists for Danish elections following the 2007 municipal reform. It consists of Herlev and Rødovre municipality. It was created in 1966 and has maintained its boundaries since then.
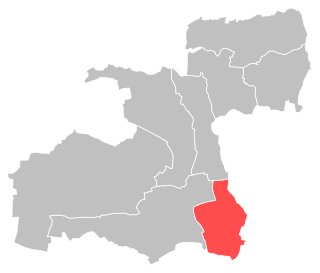
<span class="mw-page-title-main">Hvidovre (nomination district)</span>

Hvidovre nominating district is one of the 92 nominating districts that exists for Danish elections following the 2007 municipal reform. It consists of Hvidovre Municipality. It was created in 1953, though its boundaries have been changed since then.

<span class="mw-page-title-main">Østerbro (nomination district)</span>

Østerbro nominating district is one of the 92 nominating districts in Denmark. It was latest updated following the 2007 municipal reform. It is one of the 9 nominating districts in Copenhagen Municipality. It was created in 1915, though its boundaries have been changed since then.

<span class="mw-page-title-main">Brønshøj (nomination district)</span>

Brønshøj nominating district is one of the 92 nominating districts that exists for Danish elections following the 2007 municipal reform. It is one of the 9 nominating districts in Copenhagen Municipality. It was created in 1950, though its boundaries have been changed since then.

<span class="mw-page-title-main">Valby (nomination district)</span>

Valby nominating district is one of the 92 nominating districts that was created for Danish elections following the 2007 municipal reform. It is one of the 9 nominating districts in Copenhagen Municipality. It was created in 1895. In 1915 its boundaries were changed, and it became a nomination district. In 1953 it was divided into Valby-vest and Valby-øst. Valby-vest was renamed Valby from 1970 onwards, and this nomination district was expanded in area in 2007.
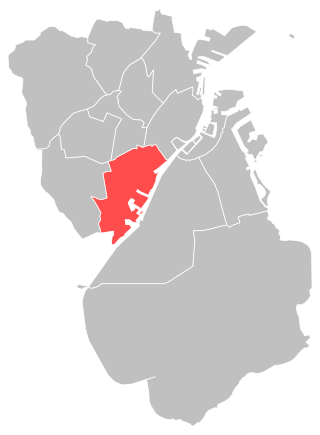
<span class="mw-page-title-main">Vesterbro (nomination district)</span>

Vesterbro nominating district is one of the 92 nominating districts exists for Danish elections following the 2007 municipal reform. It is one of the 9 nominating districts in Copenhagen Municipality. It was created in 1915, though its boundaries have been changed since then.

<span class="mw-page-title-main">Slots (nomination district)</span>

Slots nominating district is one of the 92 nominating districts that exists for Danish elections following the 2007 municipal reform. It is one of the 2 nominating districts in Frederiksberg Municipality, the other being Falkoner. It was created in 1915 and has maintained its boundaries since then.

<span class="mw-page-title-main">Tårnby (nomination district)</span>

Tårnby nominating district is one of the 92 nominating districts that was created for Danish elections following the 2007 municipal reform. It consists of Dragør and Tårnby municipality. It has existed under the current boundaries since 1966. Prior to 2007 it was known as the Amager district.

<span class="mw-page-title-main">Rønne (nomination district)</span>

Rønne nominating district is one of the 92 nominating districts that was created for Danish elections following the 2007 municipal reform. It is one of the 2 nominating districts in Bornholm Municipality, the other being Aakirkeby. It was created in 1849 as a constituency, and has been a nomination district since 1920, though its boundaries were changed in 1970.

References

  1. "Ballerupkredsen". kmdvalg.dk (in Danish). Retrieved 2023-06-08.
  2. "Forslag til Lov om ændring af lov om valg til Folketinget" (PDF). Folketingstidende. 4 June 1970.
  3. "Nye valgkredse fordeler stemmerne anderledes". dr.dk (in Danish). Retrieved 2023-06-08.
  4. "Beretning om nye valgkredse som følge af kommunalreformen" (in Danish). Retrieved 2023-06-08.
  5. "Det danske valgsystem: Valg til Folketinget". valg.im (in Danish). Retrieved 2023-06-08.
  6. "20 Ballerup". dataforsyningen.dk (in Danish). Retrieved 2023-06-08.
  7. "Forslag til Lov om ændring af lov om valg til Folketinget" (PDF). Folketingstidende. 4 June 1970.
  8. "Valgresultater fra tidligere valg:". kmdvalg (in Danish). Retrieved 2023-06-08.
  9. "FOLKETINGSVALG TIRSDAG 1. NOVEMBER 2022". valg.im (in Danish). Retrieved 2023-06-27.
  10. "FOLKETINGSVALG ONSDAG 5. JUNI 2019". valg.im (in Danish). Retrieved 2023-06-27.
  11. "FOLKETINGSVALG TORSDAG 18. JUNI 2015". valg.im (in Danish). Retrieved 2023-06-27.
  12. "FOLKETINGSVALG TORSDAG 15. SEPTEMBER 2011". valg.im (in Danish). Retrieved 2023-06-27.
  13. "Folketingsvalget den 13. november 2007". valg.im (in Danish). Retrieved 2023-06-27.
  14. "valg2005.book" (PDF). valg.im (in Danish). Retrieved 2023-06-27.
  15. "BMTABEL" (PDF). valg.im (in Danish). Retrieved 2023-06-27.
  16. "VALG98" (PDF). valg.im (in Danish). Retrieved 2023-06-27.
  17. "VALG94" (PDF). valg.im (in Danish). Retrieved 2023-06-27.
  18. "VALG90" (PDF). valg.im (in Danish). Retrieved 2023-06-27.
  19. "Folketingsvalget den 10. maj 1988". valg.im (in Danish). Retrieved 2023-06-27.
  20. "Folketingsvalget den 8.september 1987". dst.dk (in Danish). Retrieved 2023-06-27.
  21. "Folketingsvalget den 10. januar 1984". dst.dk (in Danish). Retrieved 2023-06-27.
  22. "Folketingsvalget den 8. december 1981". dst.dk (in Danish). Retrieved 2023-06-27.
  23. "Folketingsvalget den 23. oktober 1979". dst.dk (in Danish). Retrieved 2023-06-27.
  24. "Folketingsvalget den 15. februar 1977". dst.dk (in Danish). Retrieved 2023-06-27.
  25. "Folketingsvalget den 9. januar 1975". dst.dk (in Danish). Retrieved 2023-06-27.
  26. "Folketingsvalget den 4. december 1973". dst.dk (in Danish). Retrieved 2023-06-27.
  27. "Folketingsvalget den 21. september 1971 samt folkeafstemningen". dst.dk (in Danish). Retrieved 2023-06-27.
  28. "EUROPA-PARLAMENTSVALG SØNDAG 9. JUNI 2024". dst.dk (in Danish). Retrieved 2024-06-10.
  29. "EUROPA-PARLAMENTSVALG SØNDAG 26. MAJ 2019". dst.dk (in Danish). Retrieved 2023-07-01.
  30. "EUROPA-PARLAMENTSVALG SØNDAG 25. MAJ 2014". dst.dk (in Danish). Retrieved 2023-07-01.
  31. "EUROPA-PARLAMENTSVALG SØNDAG 7. JUNI 2009". dst.dk (in Danish). Retrieved 2023-07-01.
  32. "EUROPA-PARLAMENTSVALGET DEN 13. JUNI 2004" (PDF). im.dk (in Danish). Retrieved 2023-07-01.
  33. "VALGET TIL EUROPA-PARLAMENTET DEN 10. JUNI 1999" (PDF). im.dk (in Danish). Retrieved 2023-07-01.
  34. "VALGET TIL EUROPA-PARLAMENTET DEN 9. JUNI 1994" (PDF). im.dk (in Danish). Retrieved 2023-07-01.
  35. "Valget til Europa-parlamentet den 15. juni 1989". dst.dk (in Danish). Retrieved 2023-07-01.
  36. "Valget til Europa-Parlamentet den 14. juni 1984". dst.dk (in Danish). Retrieved 2023-07-01.
  37. "FOLKEAFSTEMNING ONSDAG 1. JUNI 2022". dst.dk (in Danish). Retrieved 2023-07-05.
  38. "FOLKEAFSTEMNING TORSDAG 3. DECEMBER 2015". dst.dk (in Danish). Retrieved 2023-07-05.
  39. "FOLKEAFSTEMNING SØNDAG 25. MAJ 2014". dst.dk (in Danish). Retrieved 2023-07-05.
  40. "FOLKEAFSTEMNING SØNDAG 7. JUNI 2009". dst.dk (in Danish). Retrieved 2023-07-05.
  41. "FOLKEAFSTEMNINGEN DEN 28. SEPTEMBER 2000 OM DANMARKS DELTAGELSE I DEN FÆLLES VALUTA" (PDF). valg.im (in Danish). Retrieved 2023-07-05.
  42. "FOLKEAFSTEMNINGEN DEN 28. MAJ 1998OM DANMARKS TILTRÆDELSE AF AMSTERDAMTRAKTATEN" (PDF). valg.im (in Danish). Retrieved 2023-07-05.
  43. "FOLKEAFSTEMNINGEN DEN 18. MAJ 1993 OM DANMARKS TILTRÆDELSE AF EDINBURGH-AFGØRELSEN OG MAASTRICHT-TRAKTATEN". dst.dk (in Danish). Retrieved 2023-07-05.
  44. "Folkeafstemningen den 1. juni 1992 om Danmarks tiltrædelse af traktaten om Den Europæiske Union". dst.dk (in Danish). Retrieved 2023-07-05.
  45. "Vejledende folkeafstemning torsdag den 27. februar 1986 om Danmarks tiltrædelse af EF- pakken". dst.dk (in Danish). Retrieved 2023-07-05.
  46. "Folkeafstemningen om Danmarks tiltrædelse af De europæiske Fælleskaber 2. oktober 1972". dst.dk (in Danish). Retrieved 2023-07-05.