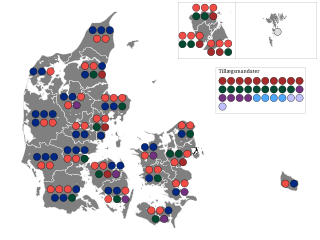
General elections were held in Denmark on 12 December 1990. Although the election resulted in a strong gain for the Social Democratic Party, Poul Schlüter's coalition government was able to continue despite the Danish Social Liberal Party leaving. Schlüter's coalition consisted of the Conservative People's Party and Venstre. Voter turnout was 83% in Denmark proper, 54% in the Faroe Islands and 51% in Greenland.

General elections were held in Denmark on 23 October 1979. The Social Democratic Party remained the largest in the Folketing, with 68 of the 179 seats. Voter turnout was 86% in Denmark proper, 65% in the Faroe Islands and 50% in Greenland.

General elections were held in Denmark on 23 January 1968. The Social Democratic Party remained the largest in the Folketing, with 62 of the 179 seats. Voter turnout was 89% in Denmark proper, 57% in the Faroe Islands and 56% in Greenland. They were the last elections in which the old counties were used as constituencies.

General elections were held in Denmark on 22 September 1964. The Social Democratic Party remained the largest in the Folketing, with 76 of the 179 seats. Voter turnout was 86% in Denmark proper, 50% in the Faroe Islands and 49% in Greenland. They were the first elections with the new electoral threshold of 2%.

General elections were held in Denmark on 14 May 1957. The Social Democratic Party remained the largest in the Folketing, with 70 of the 179 seats. Voter turnout was 84% in Denmark proper, 38% in the Faroe Islands and 62% in Greenland. The electoral threshold was 60,000 votes.

General elections were held in the Kingdom of Denmark on 22 September 1953, the first under the new constitution. The Social Democratic Party remained the largest in the Folketing, with 74 of the 179 seats. Voter turnout was 81% in Denmark proper and 69% in Greenland. The electoral threshold was 60,000 votes.

Folketing elections were held in Denmark on 21 September 1920, except in the Faroe Islands, where they were held on 30 October. They were the first in which South Jutland County participated since the Schleswig Plebiscites and the return to Danish rule, and the total number of seats in the Folketing was increased from 140 to 149. The result was a victory for Venstre, which won 51 of the 149 seats. Voter turnout was 77.0% in Denmark proper and 56.2% in the Faroe Islands.

Folketing elections were held in Denmark on 2 December 1926, except in the Faroe Islands where they were held on 20 December. The Social Democratic Party remained the largest in the Folketing, with 53 of the 149 seats. Voter turnout was 77.0% in Denmark proper and 40.2% in the Faroes.

Folketing elections were held alongside Landsting elections in Denmark on 30 October 1945, except in the Faroe Islands where they were held on 20 November. The Social Democratic Party remained the largest in the Folketing, with 48 of the 149 seats. Voter turnout was 86% in Denmark proper and 57% in the Faroes.

Folketing elections were held in Denmark on 28 October 1947, except in the Faroe Islands where they were held on 18 February 1948. The Social Democratic Party remained the largest in the Folketing, with 57 of the 150 seats. Voter turnout was 86% in Denmark proper and 60% in the Faroes.

Folketing elections were held alongside Landsting elections in Denmark on 21 April 1953, except in the Faroe Islands where they were held on 7 May. The Social Democratic Party remained the largest in the Folketing, with 61 of the 151 seats. Voter turnout was 81% in Denmark proper but just 20% in the Faroes.

Folketing elections were held in Denmark on 20 September 1872. The result was a victory for the United Left, which won 53 seats. Ludvig Holstein-Holsteinborg remained Prime Minister following the elections.

Folketing elections were held in Denmark on 7 June 1864. The National Liberal Party emerged as the largest faction, winning 40 of the 101 seats. Following the elections, Christian Albrecht Bluhme became Prime Minister on 7 July.

Folketing elections were held in Denmark on 1 December 1854. Following the elections, Peter Georg Bang became Prime Minister on 12 December.

Folketing elections were held in Denmark on 14 June 1855 in order to approve amendments to the constitution. Peter Georg Bang remained Prime Minister following the elections.

Folketing elections were held in Denmark on 14 June 1858. Carl Christian Hall remained Prime Minister following the elections.

Folketing elections were held in Denmark on 14 June 1861. Carl Christian Hall remained Prime Minister following the elections.

Elections to the Rigsrådets Folketing were held in Denmark on 30 May 1865. Christian Albrecht Bluhme remained Prime Minister after the elections, although only until November.

Folketing elections were held in Denmark on 22 September 1869. The Mellem Party emerged as the largest factions, winning 27 seats. Christian Emil Krag-Juel-Vind-Frijs remained Prime Minister.

Folketing elections were held in Denmark on 14 November 1873. The result was a narrow victory for the Højre Coalition, which won 51 of the 101 seats. Ludvig Holstein-Holsteinborg remained Prime Minister following the elections.


