1981 Danish general election

Last updated

1981 Danish general election
Flag of Denmark.svg
  1979 8 December 1981 1984  

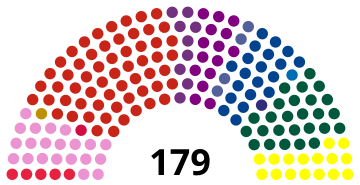
All 179 seats in the Folketing
90 seats needed for a majority
Turnout83.26%
PartyLeaderVote %Seats+/–
Social Democrats Anker Jørgensen 32.8759−9
Conservatives Poul Schlüter 14.4526+4
SF Gert Petersen 11.3121+10
Venstre Henning Christophersen 11.3120−2
Progress Mogens Glistrup 8.9116−4
Centre Democrats Erhard Jakobsen 8.2815+9
Social Liberals Niels Helveg Petersen 5.129−1
Left Socialists Collective leadership2.655−1
KrF Christian Christensen 2.314−1
Elected in the Faroe Islands
Union Pauli Ellefsen 26.4410
Social Democratic Atli Dam 24.4910
Elected in Greenland
Atassut Lars Chemnitz 48.8610
Siumut Jonathan Motzfeldt 37.7510
This lists parties that won seats. See the complete results below.
Folketingsvalget 1981 - Opstillingskredse.svg
Folketingsvalget 1981 - Kommuner.svg
Folketing1981.svg
Prime Minister beforePrime Minister-elect
Anker Jørgensen
Social Democrats
Anker Jørgensen
Social Democrats

General elections were held in Denmark on 8 December 1981. [1] The election was followed by a two-week crisis over the formation of a new government before the Social Democratic Party resumed its minority government. [2]

The Social Democratic Party lost several seats but remained the largest party in the Folketing, with 59 of the 179 seats.

Voter turnout was 83% in Denmark proper, 55% in the Faroe Islands and 61% in Greenland. [3]

Results

1981 Danish general election Result.svg
PartyVotes%Seats+/–
Denmark proper
Social Democrats 1,026,72632.8759–9
Conservative People's Party 451,47814.4526+4
Socialist People's Party 353,37311.3121+10
Venstre 353,28011.3120–2
Progress Party 278,3838.9116–4
Centre Democrats 258,5228.2815+9
Danish Social Liberal Party 160,0535.129–1
Left Socialists 82,7112.655–1
Christian People's Party 72,1742.314–1
Justice Party of Denmark 45,1741.450–5
Communist Party of Denmark 34,6251.1100
Communist Workers Party 4,2230.1400
Socialist Workers Party 2,0340.070New
Independents8070.0300
Total3,123,563100.001750
Valid votes3,123,56399.37
Invalid/blank votes19,8810.63
Total votes3,143,444100.00
Registered voters/turnout3,775,33383.26
Faroe Islands
Union Party 4,39326.4410
Social Democratic Party 4,07024.4910
Republican Party 3,44120.7100
People's Party 3,07318.4900
Self-Government 8675.2200
Progress and Fisheries Party 7734.6500
Total16,617100.0020
Valid votes16,61799.53
Invalid/blank votes790.47
Total votes16,696100.00
Registered voters/turnout30,12755.42
Greenland
Atassut 9,22348.8610
Siumut 7,12637.7510
Independents2,52913.400New
Total18,878100.0020
Valid votes18,87895.33
Invalid/blank votes9254.67
Total votes19,803100.00
Registered voters/turnout32,46661.00
Source: Nohlen & Stöver

References

  1. Dieter Nohlen & Philip Stöver (2010) Elections in Europe: A data handbook, p525 ISBN   978-3-8329-5609-7
  2. Borre, Ole (1982). "The Danish parliamentary election of 1981" . Electoral Studies. 1 (2): 250–254. doi:10.1016/0261-3794(82)90007-5. ISSN   0261-3794.
  3. Nohlen & Stöver, p545