1987 Danish general election

Last updated

1987 Danish general election
Flag of Denmark.svg
  1984 8 September 1987 1988  

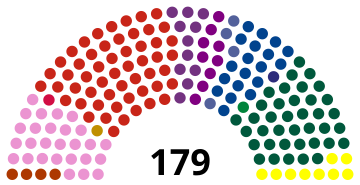
All 179 seats in the Folketing
90 seats needed for a majority
Turnout86.74%
PartyLeaderVote %Seats+/–
Social Democrats Anker Jørgensen 29.3254−2
Conservatives Poul Schlüter 20.8438−4
SF Gert Petersen 14.5827+6
Venstre Uffe Ellemann-Jensen 10.5419−3
Social Liberals Niels Helveg Petersen 6.2211+1
Centre Democrats Erhard Jakobsen 4.799+1
Progress Johannes Sørensen 4.779+3
KrF Christian Christensen 2.374−1
Common Course Preben Møller Hansen 2.164New
Elected in the Faroe Islands
People's Jógvan Sundstein 28.8410
Social Democratic Atli Dam 24.681+1
Elected in Greenland
Siumut Jonathan Motzfeldt 43.2810
Atassut Otto Steenholdt 41.3010
This lists parties that won seats. See the complete results below.
Folketingsvalget 1987 - Opstillingskredse.svg
Folketingsvalget 1987 - Kommuner.svg
Folketing1987.svg
Prime Minister beforePrime Minister-elect
Poul Schlüter
Conservatives
Poul Schlüter
Conservatives

General elections were held in Denmark on 8 September 1987. [1] The Social Democratic Party remained the largest in the Folketing with 54 of the 179 seats. The Conservative People's Party-led coalition government lost its majority, but since the parties on the left did not have a majority to form their own government, the incumbent government was able to continue as a minority coalition government. [2] Voter turnout was 87% in Denmark proper, 69% in the Faroe Islands and 45% in Greenland. [3]

Contents

Results

1987 Danish general election Result.svg
PartyVotes%Seats+/–
Denmark proper
Social Democrats 985,90629.3254–2
Conservative People's Party 700,88620.8438–4
Socialist People's Party 490,17614.5827+6
Venstre 354,29110.5419–3
Danish Social Liberal Party 209,0866.2211+1
Centre Democrats 161,0704.799+1
Progress Party 160,4614.779+3
Christian People's Party 79,6642.374–1
Common Course 72,6312.164New
Left Socialists 46,1411.370–5
The Greens 45,0761.340New
Communist Party of Denmark 28,9740.8600
Justice Party of Denmark 16,3590.4900
Humanist Party 5,6750.170New
Socialist Workers Party 1,8080.0500
Communist Party of Denmark/Marxist–Leninists 9870.0300
Independents3,3660.1000
Total3,362,557100.001750
Valid votes3,362,55799.21
Invalid/blank votes26,6440.79
Total votes3,389,201100.00
Registered voters/turnout3,907,45486.74
Faroe Islands
People's Party 6,41128.8410
Social Democratic Party 5,48624.681+1
Union Party 5,34524.050–1
Republican Party 3,47815.6500
Self-Government 1,0704.8100
Progress Party4381.970New
Total22,228100.0020
Valid votes22,22899.30
Invalid/blank votes1570.70
Total votes22,385100.00
Registered voters/turnout32,48468.91
Greenland
Siumut 6,94443.2810
Atassut 6,62741.3010
Inuit Ataqatigiit 2,00112.4700
Polar Party 4742.950New
Total16,046100.0020
Valid votes16,04694.50
Invalid/blank votes9345.50
Total votes16,980100.00
Registered voters/turnout37,80044.92
Source: Nohlen & Stöver

See also

References

  1. Dieter Nohlen & Philip Stöver (2010) Elections in Europe: A data handbook, p. 525 ISBN   978-3-8329-5609-7
  2. Borre, Ole (1988-04-01). "The Danish general election of 1987" . Electoral Studies. 7 (1): 75–78. doi:10.1016/0261-3794(88)90021-2. ISSN   0261-3794.
  3. Nohlen & Stöver, p547