Belgian general election, 1971

Last updated
Belgian general election, 1971
Flag of Belgium (civil).svg
  1968 7 November 1971 1974  

212 seats in the Chamber of Representatives

 First partySecond partyThird party
  Gaston Eyskens (1969).jpg No image.png No image.png
Leader Gaston Eyskens Jos Van Eynde Edmond Leburton
Party CVP Socialist Socialist
Leader sinceCandidate for PM19711971
Last electionNew59 seats, 27.10% [a] 59 seats, 27.10% [a]
Seats won402525
Seat changeNewDecrease2.svg 34Decrease2.svg 34
Popular vote967,701623,395549,483
Percentage18.32%11.80%10.40%
SwingNewDecrease2.svg 15.30%Decrease2.svg 16.70%

 Fourth partyFifth partySixth party
  No image.png No image.png No image.png
LeaderFrans Van der Elst Pierre Descamps Robert J. Houben
Party VU PVV PSC
Leader since195519691966
Last election20 seats, 9.79%47 seats, 20.87%New
Seats won211615
Seat changeIncrease2.svg 1Decrease2.svg 31New
Popular vote586,917392,130327,393
Percentage11.11%7.42%6.20%
SwingIncrease2.svg 1.32%Decrease2.svg 13.45%New

Belgian federal election 1971 - Chamber - circumscriptions.svg
Colours denote the winning party in each electoral district (for the Chamber of Deputies).
a Beginning in 1971, the Belgian Socialist Party ran as separate lists for Flanders and Wallonia, however they still existed as a single party, hence why both show their previous united results.

Prime Minister before election

Gaston Eyskens
CVP

Elected Prime Minister

Gaston Eyskens
CVP

State Coat of Arms of Belgium.svg
This article is part of a series on the
politics and government of
Belgium
Constitution
Foreign relations

General elections were held in Belgium on 7 November 1971. [1] The result was a victory for the Christian People's Party, which won 40 of the 212 seats in the Chamber of Representatives and 34 of the 106 seats in the Senate. Voter turnout was 91.5%. [2] Elections to the nine provincial councils were also held.

Belgium Federal constitutional monarchy in Western Europe

Belgium, officially the Kingdom of Belgium, is a country in Western Europe. It is bordered by the Netherlands to the north, Germany to the east, Luxembourg to the southeast, France to the southwest, and the North Sea to the northwest. It covers an area of 30,688 square kilometres (11,849 sq mi) and has a population of more than 11.4 million. The capital and largest city is Brussels; other major cities are Antwerp, Ghent, Charleroi and Liège.

<i>Christen-Democratisch en Vlaams</i> political party in Flanders/Belgium

Christian Democratic and Flemish is a Christian democratic Flemish political party in Belgium. The party has historical ties to both trade unionism (ACV) and trade associations (UNIZO) and the Farmer's League. Until 2001, the party was named the Christian People's Party.

Provinces of Belgium subdivision of Belgium

The country of Belgium is divided into three regions. Two of these regions, the Flemish Region or Flanders, and Walloon Region, or Wallonia, are each subdivided into five provinces. The third region, the Brussels-Capital Region, is not divided into provinces, as it was originally only a small part of a province itself.

Contents

The linguistic issues led to the splitting of the major parties into separate Flemish and Francophone parties. Consequently the election returned a very fragmented parliament.

The election followed the first state reform, with the creation of three cultural communities. The newly elected members of parliament would thus also serve in the newly established cultural councils.

State reform in Belgium

The term State reform in the Belgian context refers to the ongoing process of seeking and finding constitutional and legal solutions to the problems and tensions that exist among the different segments of the Belgian population, mostly between the Dutch-speakers of Flanders and the French-speakers of Wallonia. In general, Belgium has evolved from a unitary state to a federal state with communities, regions, and language areas.

Results

Chamber of Representatives

PartyVotes%Seats+/–
Christian People's Party (CVP)967,70118.3240New
Belgian Socialist Party (Flanders) (BSP)623,39511.8025New
People's Union (Volksunie)586,91711.1121+1
Belgian Socialist Party (Wallonia) (PSB)549,48310.4025New
Party for Freedom and Progress (PVV)392,1307.4216New
Christian Social Party (PSC)327,3936.2015New
Walloon Rally (RW)306,6065.8112+6
PSC-CVP 292,1015.5312−57
FDF-RW 286,6395.4312New
Party for Freedom and Progress (Wallonia) (PLP)275,7765.2211New
Belgian Socialist Party (Brussels) 162,8523.087New
PVV/PLP 107,6152.044–43
Red Lions 104,0401.974+4
Communist Party (Wallonia) (PC)91,7261.744New
Party for Freedom and Progress (Brussels) 90,1341.713New
Communist Party (Flanders) (KP)67,4871.281New
LOB-LIB21,9190.420New
Onaf Christ7,8010.150New
LVV2,7400.050New
Trotskyists2,6600.0500
Kaganovemus2,5800.050New
PCB2,3040.0400
Van Meerhage2,0040.040New
Z Kleur1,5470.0300
DPU1,5340.030New
Francophone Party1,4710.030New
New Party8990.020New
U Verbruik6400.010New
Dieferenbes6330.0100
De Keyzer5650.010New
R D Wal3390.010New
Invalid/blank votes459,637
Total5,741,2681002120
Source: Belgian Elections

Senate

PartyVotes%Seats+/–
CVP-PSC 1,547,85329.7034+5
Party for Freedom and Progress (PVV-PLP)776,51414.9015−7
Belgian Socialist Party (Wallonia) (PSB)710,43713.6316New
Belgian Socialist Party (Flanders) (BSP)615,80511.826New
FDF-RW 598,76811.496+1
People's Union (Volksunie)592,50911.3712+3
Communist Party of Belgium (KPB-PCB)106,7992.051−1
BSPRed Lions 97,3711.870New
Liberal Democrat and Pluralist Party81,1331.562New
UDP61,6161.180New
LIB-LOB15,1380.290New
Kaganovemus3,8000.0700
LVV3,1590.060New
Valentyn5130.010New
Invalid/blank votes415,246
Total5,626,6611001060
Source: Belgian Elections

Related Research Articles

1954 Belgian general election

General elections were held in Belgium on 11 April 1954. The dominant Christian Social Party won 95 of the 212 seats in the Chamber of Representatives and 49 of the 106 seats in the Senate. Voter turnout was 93.2%. Elections for the nine provincial councils were also held.

1965 Belgian general election

General elections were held in Belgium on 23 May 1965. The result was a victory for the Christian Social Party, which won 77 of the 212 seats in the Chamber of Representatives and 44 of the 106 seats in the Senate. Voter turnout was 91.6%. Elections for the nine provincial councils were also held.

1974 Belgian general election elections in Belgium

General elections were held in Belgium on 10 March 1974. The Belgian Socialist Party emerged as the largest faction in the Chamber of Representatives with 59 of the 212 seats. Voter turnout was 90.3%. Elections were also held for the nine provincial councils, as well as for the Council of the German Cultural Community for the first time.

1977 Belgian general election elections in Belgium

General elections were held in Belgium on 17 April 1977. The result was a victory for the Christian People's Party, which won 56 of the 212 seats in the Chamber of Representatives and 28 of the 106 seats in the Senate. Voter turnout was 95.1%. Elections were also held for the nine provincial councils and for the Council of the German Cultural Community.

1981 Belgian general election

General elections were held in Belgium on 8 November 1981. Voter turnout was 94.5% in the Chamber election and 94.6% in the Senate election. Elections were also held for the nine provincial councils and for the Council of the German Cultural Community. They were the first elections after the voting age was lowered from 21 to 18. This contributed to the success of the socialist parties and the green parties. The traditionally largest Christian People's Party saw significant losses, with only 43 of the 212 seats in the Chamber of Representatives.

1978 Belgian general election

General elections were held in Belgium on 17 December 1978. The Christian People's Party emerged as the largest party, with 57 of the 212 seats in the Chamber of Representatives and 29 of the 106 seats in the Senate. Voter turnout was 94.8%. Elections were also held for the nine provincial councils and for the Council of the German Cultural Community.

Federal elections were held in Switzerland on 28 October 1928. Although the Social Democratic Party received the most votes, the Free Democratic Party remained the largest party in the National Council, winning 58 of the 198 seats.

Federal elections were held in Switzerland on 25 October 1931. Although the Social Democratic Party received the most votes, the Free Democratic Party remained the largest party in the National Council, winning 52 of the 187 seats.

Federal elections were held in Switzerland on 29 October 1967. The Social Democratic Party remained the largest party in the National Council, winning 50 of the 200 seats.

Federal elections were held in Switzerland on 27 October 1963. The Social Democratic Party emerged as the largest party in the National Council, winning 53 of the 200 seats.

Federal elections were held in Switzerland on 25 October 1959. The Social Democratic Party and the Free Democratic Party emerged as the largest parties in the National Council, each winning 51 of the 196 seats.

Federal elections were held in Switzerland on 30 October 1955. The Social Democratic Party emerged as the largest party in the National Council, winning 53 of the 196 seats.

Federal elections were held in Switzerland on 28 October 1951. Although the Social Democratic Party received the most votes, the Free Democratic Party remained the largest party in the National Council, winning 51 of the 196 seats.

Federal elections were held in Switzerland on 26 October 1947. Although the Social Democratic Party received the most votes, the Free Democratic Party emerged as the largest party in the National Council, winning 52 of the 194 seats.

1981 Andorran parliamentary election

Parliamentary elections were held in Andorra on 9 December 1981, with a second round of voting on 16 December. Local elections were held on the same day. Following the elections, Òscar Ribas Reig became the country's first Prime Minister.

1861 Italian general election

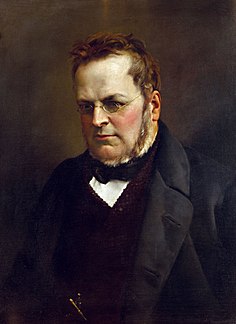
General elections were held in Italy on 27 January 1861, with a second round on 3 February. The newly elected Parliament first convened in Turin on 4 March 1861, where, thirteen days later, it declared the unification of the country as the Kingdom of Italy.

Federal elections were held in Switzerland on 26 October 1919. The Free Democratic Party emerged as the largest party in the National Council, winning 60 of the 189 seats.

Federal elections were held in Switzerland on 29 October 1922. The Free Democratic Party remained the largest party in the National Council, winning 60 of the 198 seats.

Federal elections were held in Switzerland on 25 October 1925. The Free Democratic Party remained the largest party in the National Council, winning 60 of the 198 seats.

Federal elections were held in Switzerland on 29 October 1939. The Free Democratic Party emerged as the largest party in the National Council, winning 49 of the 187 seats. Due to the outbreak of World War II, there were no elections in nine of the 25 cantons; Appenzell Ausserrhoden, Lucerne, Neuchâtel, Schwyz, Solothurn, Ticino, Valais, Vaud and Zug. In what became known as "silent elections", a total of 55 candidates were elected unopposed.

References

  1. Dieter Nohlen & Philip Stöver (2010) Elections in Europe: A data handbook, p289 ISBN   978-3-8329-5609-7
  2. Nohlen & Stöver, p291