Cambridge (provincial electoral district)

Last updated
Cambridge
Flag of Ontario.svg Ontario electoral district
Cambridge riding.PNG
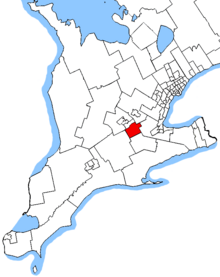
Cambridge in relation to other southwestern Ontario electoral districts
Provincial electoral district
Legislature Legislative Assembly of Ontario
MPP


Brian Riddell
Progressive Conservative
District created1975
First contested 1975
Last contested 2025
Demographics
Population (2016)115,460
Electors (2018)88,380
Area (km²)355
Pop. density (per km²)325.2
Census division(s) Waterloo
Census subdivision(s) Cambridge, North Dumfries

Cambridge is a provincial electoral district in southwestern, Ontario, Canada. It elects one member to the Legislative Assembly of Ontario.

Contents

It was created in 1975.

From 1987 to 1999, it consisted of the city of Cambridge plus that part the township of North Dumfries located directly to the east of Cambridge.

From 1999 to 2007 it consisted of Cambridge, North Dumfries plus the city of Kitchener east of a line following Homer Watson Boulevard to Doon Village Road to Homer Watson Boulevard again, then to Huron Road to the Grand River.

Since 2007, the riding has included only Cambridge and North Dumfries.

Members of Provincial Parliament

Cambridge
AssemblyYearsMemberParty
Riding created
30th  1975–1977   Monty Davidson New Democratic
31st  1977–1981
32nd  1981–1985   Bill Barlow Progressive Conservative
33rd  1985–1987
34th  1987–1990   Michael Farnan New Democratic
35th  1990–1995
36th  1995–1999   Gerry Martiniuk Progressive Conservative
37th  1999–2003
38th  2003–2007
39th  2007–2011
40th  2011–2014 Rob Leone
41st  2014–2018   Kathryn McGarry Liberal
42nd  2018–2020   Belinda Karahalios Progressive Conservative
 2020–2021   Independent
 2021–2022   New Blue
43rd  2022–present   Brian Riddell Progressive Conservative

Election results

2025 Ontario general election
** Preliminary results — Not yet official **
PartyCandidateVotes%±%Expenditures
Progressive Conservative Brian Riddell 19,19543.7+6.7
Liberal Rob Deutschmann15,12134.4+13.7
New Democratic Marjorie Knight5,07311.6–10.7
Green Carla Johnson2,5155.7–3.3
New Blue Belinda Karahalios 2,0254.6–6.5
Total valid votes/expense limit
Total rejected, unmarked, and declined ballots
Turnout45.9+2.7
Eligible voters95,786
Progressive Conservative hold Swing –3.5
Source: Elections Ontario [1]
2022 Ontario general election
PartyCandidateVotes%±%Expenditures
Progressive Conservative Brian Riddell 14,59037.03+0.06$84,737
New Democratic Marjorie Knight8,74522.1910.30$54,806
Liberal Surekha Shenoy8,15520.702.55$77,446
New Blue Belinda Karahalios 4,37411.10-25.87$98,338
Green Carla Johnson3,5378.98+2.71$14,902
Total valid votes/expense limit39,40199.52+0.81$128,747
Total rejected, unmarked, and declined ballots1900.48-0.81
Turnout39,59143.22-11.95
Eligible voters91,954
Progressive Conservative gain from New Blue Swing +5.18
Source(s)
  • "Summary of Valid Votes Cast for Each Candidate" (PDF). Elections Ontario. 2022. Archived from the original on 2023-05-18.
  • "Statistical Summary by Electoral District" (PDF). Elections Ontario. 2022. Archived from the original on 2023-05-21.
2018 Ontario general election
PartyCandidateVotes%±%
Progressive Conservative Belinda Karahalios 17,79336.97%+4.41
New Democratic Marjorie Knight15,63932.49%+10.88
Liberal Kathryn McGarry 11,19123.25%-15.67
Green Michele Braniff3,0186.27%+0.61
Libertarian Allan Dettweiler4901.02%-0.24
Total valid votes100.0  
Progressive Conservative gain from Liberal Swing -
Source: Elections Ontario [2]
2014 Ontario general election
PartyCandidateVotes%±%
Liberal Kathryn McGarry 18,76338.92+5.85
Progressive Conservative Rob Leone 15,69432.56-5.13
New Democratic Bobbi Stewart10,41521.61-3.00
Green Temara Brown2,7265.66+3.16
Libertarian Allan R. Dettweiler6051.26-0.23
Total valid votes48,203100.0  
Liberal gain from Progressive Conservative Swing +5.49
Source: Elections Ontario [3]
2011 Ontario general election
PartyCandidateVotes%±%
Progressive Conservative Rob Leone 15,94737.69-3.97
Liberal Kathryn McGarry 13,99333.07-1.04
New Democratic Atinuke Bankole10,41424.61+10.81
Green Jacques Malette1,0562.50-6.43
Libertarian Allan Dettweiler6291.49 
Independent Robert Ross2710.64 
Total valid votes 42,310100.00
Total rejected, unmarked and declined ballots1870.44
Turnout42,49746.04
Eligible voters92,310
Progressive Conservative hold Swing -1.47
Source: Elections Ontario [4]
2007 Ontario general election
PartyCandidateVotes%±%
Progressive Conservative Gerry Martiniuk 17,88441.66-0.84
Liberal Kathryn McGarry 14,64134.11-1.08
New Democratic Mitchell Healey5,92313.80-4.29
Green Colin Carmichael3,8358.93+6.84
Family Coalition Paul Vendervet6501.50-0.63
Total valid votes 42,933 100.00
2003 Ontario general election
PartyCandidateVotes%±%
Progressive Conservative Gerry Martiniuk 19,99642.50-12.34
Liberal Jerry Boyle16,55935.19+12.34
New Democratic Pam Wolf8,51318.09-1.28
Family Coalition Al Smith10012.13+0.29
Green Michael Chownyk 9832.09+1.00
Total valid votes 47,052 100.00
1999 Ontario general election
PartyCandidateVotes%±%
Progressive Conservative Gerry Martiniuk 24,58354.84+7.91
Liberal Jerry Boyle10,24422.85+7.61
New Democratic Gary Gibson8,68419.37-12.69
Family Coalition Al Smith8241.84-2.75
Green Kathleen Morton4891.09
Total valid votes44,824100.00
1995 Ontario general election
PartyCandidateVotes%±%
Progressive Conservative Gerry Martiniuk 17,26946.93+34.63
New Democratic Mike Farnan 11,79732.06-28.22
Liberal Ben Tucci5,60615.24-5.65
Family Coalition Al Smith1,6904.59-1.94
Independent Reg Gervais4331.18
Total valid votes36,795100.0
1990 Ontario general election
PartyCandidateVotes%±%
New Democratic Mike Farnan 21,80660.28+25.79
Liberal John Bell7,55720.89-13.29
Progressive Conservative Carl DeFaria 4,44912.30-14.45
Family Coalition Anneliese Steden2,3646.53+1.95
Total valid votes36,176100.0
1987 Ontario general election
PartyCandidateVotes%±%
New Democratic Mike Farnan 11,28434.49-3.01
Liberal Claudette Millar 11,18334.18+12.02
Progressive Conservative Bill Barlow 8,75226.75-13.59
Family Coalition Anneliese Steden1,5004.58
Total valid votes32,719100.0
1985 Ontario general election
PartyCandidateVotes%±%
Progressive Conservative Bill Barlow 12,88840.34-2.48
New Democratic Mike Farnan 11,98537.50-2.43
Liberal Bob Jeffrey7,08322.16+6.77
Total valid votes31,956100.0
1981 Ontario general election
PartyCandidateVotes%±%
Progressive Conservative Bill Barlow 12,59742.82+7.37
New Democratic Monty Davidson 11,74839.93+2.62
Liberal John Giles4,52715.39-11.01
Independent George Molson Barrett5491.87
Total valid votes29,421100.0
1977 Ontario general election
PartyCandidateVotes%±%
New Democratic Monty Davidson 11,12037.31-0.83
Progressive Conservative Bill Barlow 10,56635.45+6.33
Liberal Claudette Millar 7,87026.40-6.34
Independent John Long2520.85
Total valid votes29,808100.0
1975 Ontario general election
PartyCandidateVotes%
New Democratic Monty Davidson 11,25538.14
Liberal Claudette Millar 9,66232.74
Progressive Conservative Ruggles Constant8,59529.12
Total valid votes29,512100.0

2007 electoral reform referendum

2007 Ontario electoral reform referendum
SideVotes%
First Past the Post25,90261.4
Mixed member proportional16,26038.6
Total valid votes42,162100.0

Sources

  1. "Cambridge Unofficial Election Results". Elections Ontario. 28 February 2025. Retrieved 28 February 2025.
  2. "Summary of Valid Votes Cast for each Candidate" (PDF). Elections Ontario. Archived from the original (PDF) on 28 December 2018. Retrieved 16 January 2019.
  3. Elections Ontario (2014). "Official return from the records, 012 Cambridge" (PDF). Retrieved 27 June 2015.[ permanent dead link ]
  4. Elections Ontario (2011). "Official return from the records / Rapport des registres officiels - Cambridge" (PDF). Retrieved 2 June 2014.[ permanent dead link ]

43°20′53″N80°20′06″W / 43.348°N 80.335°W / 43.348; -80.335