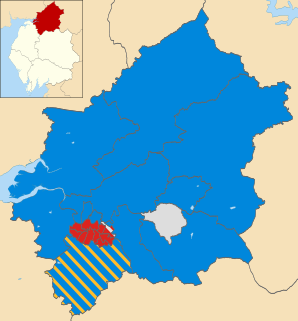
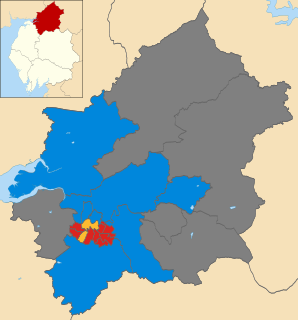
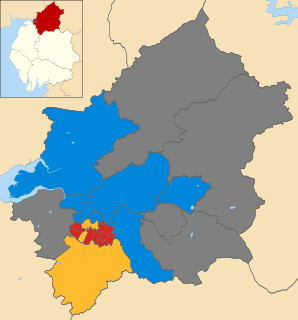
The 2003 Carlisle City Council election took place on 1 May, 2003 to elect members of Carlisle District Council in Cumbria, England. One third of the council was up for election and the Conservative party lost overall control of the council to no overall control. [1]
The City of Carlisle is a local government district of Cumbria, England, with the status of a city and non-metropolitan district. It is named after its largest settlement, Carlisle, but covers a far larger area which includes the towns of Brampton and Longtown, as well as outlying villages including Dalston, Scotby and Wetheral. The city has a population of 107,524. and an area of 1,039.97 square kilometres (402 sq mi), making it the largest city in England by area.
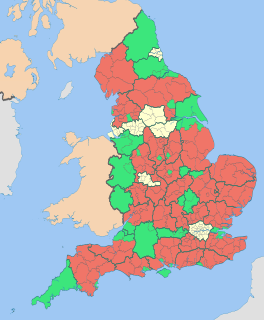
Non-metropolitan districts, or colloquially "shire districts", are a type of local government district in England. As created, they are sub-divisions of non-metropolitan counties in a two-tier arrangement.
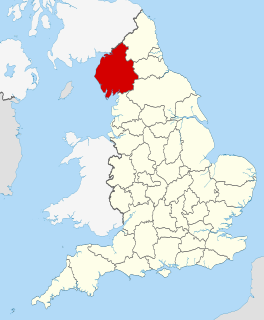
Cumbria is a ceremonial and non-metropolitan county in North West England. The county and Cumbria County Council, its local government, came into existence in 1974 after the passage of the Local Government Act 1972. Cumbria's county town is Carlisle, in the north of the county, and the only other major urban area is Barrow-in-Furness on the southwestern tip of the county.
After the election, the composition of the council was
The Conservative Party, officially the Conservative and Unionist Party, is a centre-right political party in the United Kingdom. Presently led by Theresa May, it has been the governing party since 2010. It presently has 314 Members of Parliament in the House of Commons, 249 members of the House of Lords, and 18 members of the European Parliament. It also has 31 Members of the Scottish Parliament, 12 members of the Welsh Assembly, eight members of the London Assembly and 9,008 local councillors. One of the major parties of UK politics, it has formed the government on 45 occasions, more than any other party.
The Labour Party is a centre-left political party in the United Kingdom which has been described as an alliance of social democrats, democratic socialists and trade unionists. The party's platform emphasises greater state intervention, social justice and strengthening workers' rights.
The Liberal Democrats are a liberal political party in the United Kingdom. They presently have 11 Members of Parliament in the House of Commons, 96 members of the House of Lords, and one member of the European Parliament. They also have five Members of the Scottish Parliament and a member each in the Welsh Assembly and London Assembly. The party reached the height of its influence in the early 2010s, forming a junior partner in a coalition government from 2010 to 2015. It is presently led by Vince Cable.
Overall turnout at the election was 31.4%, slightly down from the 31.7% in 2002. [3]
Voter turnout is the percentage of eligible voters who cast a ballot in an election. Eligibility varies by country, and the voting-eligible population should not be confused with the total adult population. Age and citizenship status are often among the criteria used to determine eligibility, but some countries further restrict eligibility based on sex, race, or religion.
Party | Seats | Gains | Losses | Net gain/loss | Seats % | Votes % | Votes | +/− | |
---|---|---|---|---|---|---|---|---|---|
Conservative | 9 | 0 | 3 | -3 | 47.4 | 41.1 | 9,317 | -1.8% | |
Labour | 8 | 4 | 0 | +4 | 42.1 | 44.1 | 10,016 | +0.2% | |
Liberal Democrat | 2 | 0 | 0 | 0 | 10.5 | 14.6 | 3,304 | +3.6% | |
Independent | 0 | 0 | 1 | -1 | 0 | 0.3 | 59 | -1.8% |
Party | Candidate | Votes | % | ± | |
---|---|---|---|---|---|
Conservative | Alan Toole | 948 | 59.3 | -1.0 | |
Labour | Mohammed Harid | 650 | 40.7 | +1.0 | |
Majority | 298 | 18.6 | -1.9 | ||
Turnout | 1,598 | 34.3 | |||
Conservative hold | Swing |
Party | Candidate | Votes | % | ± | |
---|---|---|---|---|---|
Labour | Mary Styth | 570 | 47.2 | -1.2 | |
Conservative | Neville Lishman | 425 | 35.2 | -2.7 | |
Liberal Democrat | James Tootle | 153 | 12.7 | +1.2 | |
Independent | Steven Cochrane | 59 | 4.9 | +4.9 | |
Majority | 145 | 12.0 | +1.6 | ||
Turnout | 1,207 | 29.2 | |||
Labour hold | Swing |
Party | Candidate | Votes | % | ± | |
---|---|---|---|---|---|
Labour | Charles Scarborough | 698 | 60.7 | -2.4 | |
Conservative | Gareth Ellis | 452 | 39.3 | +2.4 | |
Majority | 246 | 21.4 | -4.8 | ||
Turnout | 1,150 | 26.0 | |||
Labour gain from Conservative | Swing | ||||
Party | Candidate | Votes | % | ± | |
---|---|---|---|---|---|
Conservative | John Collier | 391 | 72.5 | ||
Labour | Robin Pearson | 148 | 27.5 | ||
Majority | 243 | 45.1 | |||
Turnout | 539 | 34.0 | |||
Conservative hold | Swing |
Party | Candidate | Votes | % | ± | |
---|---|---|---|---|---|
Liberal Democrat | Thomas Hodgson | 603 | 57.6 | +8.5 | |
Labour | Raymond Warwick | 443 | 42.4 | +9.0 | |
Majority | 160 | 15.3 | -0.5 | ||
Turnout | 1,046 | 24.7 | |||
Liberal Democrat hold | Swing |
Party | Candidate | Votes | % | ± | |
---|---|---|---|---|---|
Labour | Richard Im Thurn | 719 | 72.6 | -5.1 | |
Conservative | David Blackadder | 272 | 27.4 | +5.1 | |
Majority | 447 | 45.1 | -10.2 | ||
Turnout | 991 | 23.1 | |||
Labour gain from Independent | Swing | ||||
Party | Candidate | Votes | % | ± | |
---|---|---|---|---|---|
Conservative | Brian Dodd | 780 | 45.5 | -2.9 | |
Liberal Democrat | Trevor Allison | 654 | 38.1 | +4.2 | |
Labour | Ann Warwick | 281 | 16.4 | -1.3 | |
Majority | 126 | 7.3 | -7.2 | ||
Turnout | 1,715 | 40.4 | |||
Conservative hold | Swing |
Party | Candidate | Votes | % | ± | |
---|---|---|---|---|---|
Labour | Hugh McDevitt | 834 | 70.9 | +3.4 | |
Conservative | Stephen Metcalfe | 232 | 19.7 | +2.1 | |
Liberal Democrat | Olwyn Luckley | 111 | 9.4 | -5.5 | |
Majority | 602 | 51.1 | +1.2 | ||
Turnout | 1,177 | 26.9 | |||
Labour hold | Swing |
Party | Candidate | Votes | % | ± | |
---|---|---|---|---|---|
Labour | Cyril Weber | 851 | 67.3 | +5.2 | |
Conservative | Michele Gwillim | 311 | 24.6 | -13.3 | |
Liberal Democrat | Eileen Aldersey | 102 | 8.1 | +8.1 | |
Majority | 540 | 42.7 | +18.4 | ||
Turnout | 1,264 | 28.3 | |||
Labour hold | Swing |
Party | Candidate | Votes | % | ± | |
---|---|---|---|---|---|
Conservative | James Knapton | 419 | 76.5 | ||
Labour | Alex Faulds | 129 | 23.5 | ||
Majority | 290 | 52.9 | |||
Turnout | 548 | 33.7 | |||
Conservative hold | Swing |
Party | Candidate | Votes | % | ± | |
---|---|---|---|---|---|
Conservative | John Jefferson | 568 | 62.2 | +3.0 | |
Labour | Robert Dodds | 345 | 37.8 | -3.0 | |
Majority | 223 | 24.4 | +6.0 | ||
Turnout | 913 | 29.0 | |||
Conservative hold | Swing |
Party | Candidate | Votes | % | ± | |
---|---|---|---|---|---|
Conservative | Cyril Bowman | 421 | 82.7 | ||
Labour | Roger Horne | 88 | 17.3 | ||
Majority | 333 | 65.4 | |||
Turnout | 509 | 32.8 | |||
Conservative hold | Swing |
Party | Candidate | Votes | % | ± | |
---|---|---|---|---|---|
Liberal Democrat | Ralph Aldersey | 947 | 50.3 | -0.7 | |
Labour | John Bell | 935 | 49.7 | +10.9 | |
Majority | 12 | 0.6 | -11.5 | ||
Turnout | 1,882 | 39.7 | |||
Liberal Democrat hold | Swing |
Party | Candidate | Votes | % | ± | |
---|---|---|---|---|---|
Labour | Reginald Watson | 691 | 49.0 | -10.8 | |
Conservative | Lawrence Fisher | 551 | 39.1 | -1.1 | |
Liberal Democrat | Steven Tweedie | 167 | 11.9 | +11.9 | |
Majority | 140 | 9.9 | -9.6 | ||
Turnout | 1,409 | 30.8 | |||
Labour gain from Conservative | Swing | ||||
Party | Candidate | Votes | % | ± | |
---|---|---|---|---|---|
Conservative | Edward Firth | 737 | 74.3 | -3.3 | |
Labour | John Hale | 255 | 25.7 | +3.3 | |
Majority | 482 | 48.6 | -6.6 | ||
Turnout | 992 | 30.2 | |||
Conservative hold | Swing |
Party | Candidate | Votes | % | ± | |
---|---|---|---|---|---|
Conservative | Jacquelyne Geddes | 930 | 56.6 | -9.2 | |
Labour | Keith Aitken | 479 | 29.2 | -5.0 | |
Liberal Democrat | Roger O'Brienn | 234 | 14.2 | +14.2 | |
Majority | 451 | 27.4 | -4.2 | ||
Turnout | 1,643 | 35.3 | |||
Conservative hold | Swing |
Party | Candidate | Votes | % | ± | |
---|---|---|---|---|---|
Labour | Margaret Martlew | 774 | 63.8 | -5.4 | |
Conservative | Richard Hyslop | 273 | 22.5 | -8.3 | |
Liberal Democrat | James Osler | 167 | 13.8 | +13.8 | |
Majority | 501 | 41.3 | +2.9 | ||
Turnout | 1,214 | 30.2 | |||
Labour hold | Swing |
Party | Candidate | Votes | % | ± | |
---|---|---|---|---|---|
Conservative | Barry Earp | 983 | 76.9 | +15.3 | |
Labour | Helen Horne | 295 | 23.1 | +23.1 | |
Majority | 688 | 53.8 | +30.6 | ||
Turnout | 1,278 | 37.4 | |||
Conservative hold | Swing |
Party | Candidate | Votes | % | ± | |
---|---|---|---|---|---|
Labour | Joseph Hendry | 831 | 51.3 | +5.6 | |
Conservative | Bryan Hodgson | 624 | 38.5 | -5.9 | |
Liberal Democrat | Hannah Farmer | 166 | 10.2 | +0.4 | |
Majority | 207 | 12.8 | +11.5 | ||
Turnout | 1,621 | 34.0 | |||
Labour gain from Conservative | Swing | ||||
Birmingham City Council is the local government body responsible for the governance of the City of Birmingham in England, which has been a metropolitan district since 1974. It is the most populated local council in the United Kingdom with, following a reorganisation of boundaries in June 2004, 120 Birmingham City councillors representing over one million people, in 40 wards. This means that Birmingham is technically the largest city in the United Kingdom. The council headquarters are at the Council House in the city centre. The council is responsible for running nearly all local services, with the exception of those run by joint boards. The provision of certain services has in recent years been devolved to several council constituencies, which each have a constituency committee made up of councillors from that district.
One third of Carlisle City Council in Cumbria, England is elected each year, followed by one year without election. Since the last boundary changes in 1999, 52 councillors have been elected from 22 wards.
Thanet District Council in Kent, England is elected every four years.
Local elections were held in the United Kingdom on 3 May 1979. The results provided some source of comfort to the Labour Party (UK), who recovered some lost ground from local election reversals in previous years, despite losing the general election to the Conservative Party on the same day.
The 2003 Stroud Council election took place on 1 May 2003 to elect members of Stroud District Council in Gloucestershire, England. One third of the council was up for election and the Conservative party stayed in overall control of the council.
Elections to City of York Council were held on Thursday 5 May 2011. The whole council was up for election. The vote took place alongside the United Kingdom Alternative Vote referendum, 2011.
The 2003 West Somerset District Council election took place on 1 May 2003 to elect members of West Somerset District Council in Somerset, England. The whole council was up for election and the Conservative party stayed in overall control of the council.
The 1998 Carlisle City Council election took place on 7 May 1998 to elect members of Carlisle District Council in Cumbria, England. One third of the council was up for election and the Labour party stayed in overall control of the council.
The 1999 Carlisle City Council election took place on 6 May 1999 to elect members of Carlisle District Council in Cumbria, England. The whole council was up for election after boundary changes increased the number of seats by one. The Conservative party gained overall control of the council from the Labour party.
The 2000 Carlisle City Council election took place on 4 May 2000 to elect members of Carlisle District Council in Cumbria, England. One third of the council was up for election and the Conservative party stayed in overall control of the council.
The 2002 Carlisle City Council election took place on 2 May 2002 to elect members of Carlisle District Council in Cumbria, England. One third of the council was up for election and the Conservative party stayed in overall control of the council.
The 2004 Carlisle City Council election took place on 10 June 2004 to elect members of Carlisle District Council in Cumbria, England. One third of the council was up for election and the council stayed under no overall control.
The 2006 Carlisle City Council election took place on 4 May 2006 to elect members of Carlisle District Council in Cumbria, England. One third of the council was up for election and the council stayed under no overall control.
The 2007 Carlisle City Council election took place on 3 May 2007 to elect members of Carlisle District Council in Cumbria, England. One third of the council was up for election and the council stayed under no overall control.
The 2008 Carlisle City Council election took place on 1 May 2008 to elect members of Carlisle District Council in Cumbria, England. One third of the council was up for election and the council stayed under no overall control.
The 2010 Carlisle City Council election took place on 6 May 2010 to elect members of Carlisle District Council in Cumbria, England. One third of the council was up for election and the council stayed under no overall control.
The 2011 Carlisle City Council election took place on 5 May 2011 to elect members of Carlisle District Council in Cumbria, England. One third of the council was up for election and the council stayed under no overall control.
The 2012 Carlisle City Council election took place on 3 May 2012 to elect members of Carlisle District Council in Cumbria, England. One third of the council was up for election and the Labour party gained overall control of the council from no overall control.
The 2014 Carlisle City Council election took place on 22 May 2014 to elect members of Carlisle District Council in Cumbria, England. One third of the council was up for election and the Labour party stayed in overall control of the council.