Data editing

Last updated

Data editing is defined as the process involving the review and adjustment of collected survey data. [1] Data editing helps define guidelines that will reduce potential bias and ensure consistent estimates leading to a clear analysis of the data set by correct inconsistent data using the methods later in this article. [2] The purpose is to control the quality of the collected data. [3] Data editing can be performed manually, with the assistance of a computer or a combination of both. [4]

Contents

Editing methods

Editing methods refer to a range of procedures and processes used for detecting and handling errors in data. Data editing is used with the goal to improve the quality of statistical data produced. These modifications can greatly improve the quality of analytics created by aiming to detect and correct errors. Examples of different techniques to data editing such as micro-editing, macro-editing, selective editing, or the different tools used to achieve data editings such as graphical editing and interactive editing.

Interactive editing

The term interactive editing is commonly used for modern computer-assisted manual editing. Most interactive data editing tools applied at National Statistical Institutes (NSIs) allow one to check the specified edits during or after data entry, and if necessary to correct erroneous data immediately. Several approaches can be followed to correct erroneous data:

Interactive editing is a standard way to edit data. It can be used to edit both categorical and continuous data. [5] Interactive editing reduces the time frame needed to complete the cyclical process of review and adjustment. [6] Interactive editing also requires an understanding of the data set and the possible results that would come from an analysis of the data.

Selective editing

Selective editing is an umbrella term for several methods to identify the influential errors, [note 1] and outliers. [note 2] Selective editing techniques aim to apply interactive editing to a well-chosen subset of the records, such that the limited time and resources available for interactive editing are allocated to those records where it has the most effect on the quality of the final estimates of published figures. In selective editing, data is split into two streams:

The critical stream consists of records that are more likely to contain influential errors. These critical records are edited in a traditional interactive manner. The records in the non-critical stream which are unlikely to contain influential errors are not edited in a computer-assisted manner. [7]

Data editing techniques

Data editing can be accomplished in many ways and primarily depends on the data set that is being explored. [8]

Validity and completeness of data

The validity of a data set depends on the completeness of the responses provided by the respondents. One method of data editing is to ensure that all responses are complete in fields that require a numerical or non-numerical answer. See the example below.

In the above table is an example of incomplete and invalid data. See Column 1, Row 2: The answer is alphanumeric when the rest of the table is numeric. See Column 3, Row 3: The answer is incomplete and missing data. Completeness Table for Data Editing.png
In the above table is an example of incomplete and invalid data. See Column 1, Row 2: The answer is alphanumeric when the rest of the table is numeric. See Column 3, Row 3: The answer is incomplete and missing data.

Duplicate data entry

Verifying that the data is unique is an important aspect of data editing to ensure that all data provided was only entered once. This reduces the possibility for repeated data that could skew analytics reporting. See the example below.
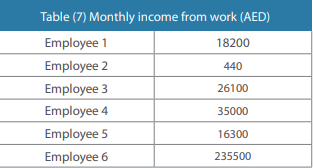
In the above table is an example of data with duplicate entries. See Sr. No 1 and 4: The data is repeated for two different entries with different indexes (Index No.). Duplicate Data Entries in Data Editing.png
In the above table is an example of data with duplicate entries. See Sr. No 1 and 4: The data is repeated for two different entries with different indexes (Index No.).

Outliers

It is common to find outliers in data sets, which as described before are values that do not fit a model of data well. These extreme values can be found based on the distribution of data points from previous data series or parallel data series for the same data set. The values can be considered erroneous and require further analysis for checking and determining the validity of the response. See the example below.

In the above table is an example of extreme values in a data set also known as outliers. See Employees 2 and 6: The data is divergent from the rest of the table. Outliers in Data Editing.png
In the above table is an example of extreme values in a data set also known as outliers. See Employees 2 and 6: The data is divergent from the rest of the table.

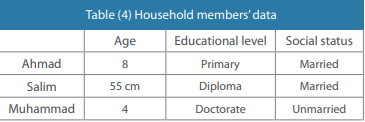
Logical inconsistencies

Logical consistency is the presence of logical relationships and interdependence between the variables. This editing requires a certain understanding around the dataset and the ability to identify errors in data based on previous reports or information. This type of data editing is used to account for the differences between data fields or variables. See the example below.

In the above table is an example of logical inconsistency in the data set. See Row 2: Salim's age is documented as 55cm, which is not logical and therefore an error in the data set. Logical Consistency in Data Editing.png
In the above table is an example of logical inconsistency in the data set. See Row 2: Salim's age is documented as 55cm, which is not logical and therefore an error in the data set.

Macro editing

There are two methods of macro editing: [7]

Aggregation method

This method is followed in almost every statistical agency before publication: verifying whether figures to be published seems plausible. This is accomplished by comparing quantities in publication tables with the same quantities in previous publications. If an unusual value is observed, a micro-editing procedure is applied to the individual records and fields contributing to the suspicious quantity. [6]

Distribution method

Data available is used to characterize the distribution of the variables. Then all individual values are compared with the distribution. Records containing values that could be considered uncommon (given the distribution) are candidates for further inspection and possibly for editing. [9]

Automatic editing

In automatic editing records are edited by a computer without human intervention. [10] Prior knowledge on the values of a single variable or a combination of variables can be formulated as a set of edit rules which specify or constrain the admissible values

Determinants of data editing

Data editing has its limitations with the capacity and resources of any given study. These determinants can have a positive or negative impact on the post-analysis of the data set. Below are several determinants of data editing. [8]

Available resources: [8]

Available Software: [8]

Data Source: [8]

Coordination of Data Editing Procedure: [8]

See also

Notes

  1. the errors that have a substantial impact on the publication figures
  2. values that do not fit a model of data well

Related Research Articles

<span class="mw-page-title-main">Data set</span> Collection of data

A data set is a collection of data. In the case of tabular data, a data set corresponds to one or more database tables, where every column of a table represents a particular variable, and each row corresponds to a given record of the data set in question. The data set lists values for each of the variables, such as for example height and weight of an object, for each member of the data set. Data sets can also consist of a collection of documents or files.

Multivariate statistics is a subdivision of statistics encompassing the simultaneous observation and analysis of more than one outcome variable, i.e., multivariate random variables. Multivariate statistics concerns understanding the different aims and background of each of the different forms of multivariate analysis, and how they relate to each other. The practical application of multivariate statistics to a particular problem may involve several types of univariate and multivariate analyses in order to understand the relationships between variables and their relevance to the problem being studied.

Observational error is the difference between a measured value of a quantity and its unknown true value. Such errors are inherent in the measurement process; for example lengths measured with a ruler calibrated in whole centimeters will have a measurement error of several millimeters. The error or uncertainty of a measurement can be estimated, and is specified with the measurement as, for example, 32.3 ± 0.5 cm.

<span class="mw-page-title-main">Statistics</span> Study of the collection, analysis, interpretation, and presentation of data

Statistics is the discipline that concerns the collection, organization, analysis, interpretation, and presentation of data. In applying statistics to a scientific, industrial, or social problem, it is conventional to begin with a statistical population or a statistical model to be studied. Populations can be diverse groups of people or objects such as "all people living in a country" or "every atom composing a crystal". Statistics deals with every aspect of data, including the planning of data collection in terms of the design of surveys and experiments.

<span class="mw-page-title-main">Sampling (statistics)</span> Selection of data points in statistics.

In statistics, quality assurance, and survey methodology, sampling is the selection of a subset or a statistical sample of individuals from within a statistical population to estimate characteristics of the whole population. Statisticians attempt to collect samples that are representative of the population. Sampling has lower costs and faster data collection compared to recording data from the entire population, and thus, it can provide insights in cases where it is infeasible to measure an entire population.

In statistics, interval estimation is the use of sample data to estimate an interval of possible values of a parameter of interest. This is in contrast to point estimation, which gives a single value.

Questionnaire construction refers to the design of a questionnaire to gather statistically useful information about a given topic. When properly constructed and responsibly administered, questionnaires can provide valuable data about any given subject.

Quantitative marketing research is the application of quantitative research techniques to the field of marketing research. It has roots in both the positivist view of the world, and the modern marketing viewpoint that marketing is an interactive process in which both the buyer and seller reach a satisfying agreement on the "four Ps" of marketing: Product, Price, Place (location) and Promotion.

<span class="mw-page-title-main">Interaction (statistics)</span> Statistical term

In statistics, an interaction may arise when considering the relationship among three or more variables, and describes a situation in which the effect of one causal variable on an outcome depends on the state of a second causal variable. Although commonly thought of in terms of causal relationships, the concept of an interaction can also describe non-causal associations. Interactions are often considered in the context of regression analyses or factorial experiments.

<span class="mw-page-title-main">Likert scale</span> Psychometric measurement scale

A Likert scale is a psychometric scale named after its inventor, American social psychologist Rensis Likert, which is commonly used in research questionnaires. It is the most widely used approach to scaling responses in survey research, such that the term is often used interchangeably with rating scale, although there are other types of rating scales.

<span class="mw-page-title-main">Questionnaire</span> Series of questions for gathering information

A questionnaire is a research instrument that consists of a set of questions for the purpose of gathering information from respondents through survey or statistical study. A research questionnaire is typically a mix of close-ended questions and open-ended questions. Open-ended, long-term questions offer the respondent the ability to elaborate on their thoughts. The Research questionnaire was developed by the Statistical Society of London in 1838.

In statistics, imputation is the process of replacing missing data with substituted values. When substituting for a data point, it is known as "unit imputation"; when substituting for a component of a data point, it is known as "item imputation". There are three main problems that missing data causes: missing data can introduce a substantial amount of bias, make the handling and analysis of the data more arduous, and create reductions in efficiency. Because missing data can create problems for analyzing data, imputation is seen as a way to avoid pitfalls involved with listwise deletion of cases that have missing values. That is to say, when one or more values are missing for a case, most statistical packages default to discarding any case that has a missing value, which may introduce bias or affect the representativeness of the results. Imputation preserves all cases by replacing missing data with an estimated value based on other available information. Once all missing values have been imputed, the data set can then be analysed using standard techniques for complete data. There have been many theories embraced by scientists to account for missing data but the majority of them introduce bias. A few of the well known attempts to deal with missing data include: hot deck and cold deck imputation; listwise and pairwise deletion; mean imputation; non-negative matrix factorization; regression imputation; last observation carried forward; stochastic imputation; and multiple imputation.

<span class="mw-page-title-main">Data dredging</span> Misuse of data analysis

Data dredging is the misuse of data analysis to find patterns in data that can be presented as statistically significant, thus dramatically increasing and understating the risk of false positives. This is done by performing many statistical tests on the data and only reporting those that come back with significant results.

Robust statistics are statistics which maintain their properties even if the underlying distributional assumptions are incorrect. Robust statistical methods have been developed for many common problems, such as estimating location, scale, and regression parameters. One motivation is to produce statistical methods that are not unduly affected by outliers. Another motivation is to provide methods with good performance when there are small departures from a parametric distribution. For example, robust methods work well for mixtures of two normal distributions with different standard deviations; under this model, non-robust methods like a t-test work poorly.

Data cleansing or data cleaning is the process of detecting and correcting corrupt or inaccurate records from a record set, table, or database and refers to identifying incomplete, incorrect, inaccurate or irrelevant parts of the data and then replacing, modifying, or deleting the dirty or coarse data. Data cleansing may be performed interactively with data wrangling tools, or as batch processing through scripting or a data quality firewall.

<span class="mw-page-title-main">Stepwise regression</span> Method of statistical factor analysis

In statistics, stepwise regression is a method of fitting regression models in which the choice of predictive variables is carried out by an automatic procedure. In each step, a variable is considered for addition to or subtraction from the set of explanatory variables based on some prespecified criterion. Usually, this takes the form of a forward, backward, or combined sequence of F-tests or t-tests.

In statistics, missing data, or missing values, occur when no data value is stored for the variable in an observation. Missing data are a common occurrence and can have a significant effect on the conclusions that can be drawn from the data.

Choice modelling attempts to model the decision process of an individual or segment via revealed preferences or stated preferences made in a particular context or contexts. Typically, it attempts to use discrete choices in order to infer positions of the items on some relevant latent scale. Indeed many alternative models exist in econometrics, marketing, sociometrics and other fields, including utility maximization, optimization applied to consumer theory, and a plethora of other identification strategies which may be more or less accurate depending on the data, sample, hypothesis and the particular decision being modelled. In addition, choice modelling is regarded as the most suitable method for estimating consumers' willingness to pay for quality improvements in multiple dimensions.

<span class="mw-page-title-main">Official statistics</span> Statistics published by government agencies

Official statistics are statistics published by government agencies or other public bodies such as international organizations as a public good. They provide quantitative or qualitative information on all major areas of citizens' lives, such as economic and social development, living conditions, health, education, and the environment.

In statistics, listwise deletion is a method for handling missing data. In this method, an entire record is excluded from analysis if any single value is missing.

References

  1. Ferguson, Dania P. "AN INTRODUCTION TO THE DATA EDITING PROCESS" (PDF). unece.org/.
  2. "National Center for Education Statistics (NCES) Home Page, part of the U.S. Department of Education". nces.ed.gov. Retrieved 2020-12-06.
  3. "UNECE".
  4. "Stat¡stics: Power from Data! Data editing". www150.statcan.gc.ca.
  5. Waal, Ton de et al. "Handbook of Statistical Data Editing and Imputation". Wiley publication, 2011, p.15.
  6. 1 2 "UNECE Homepage". www.unece.org.
  7. 1 2 Waal, Ton de et al. "Handbook of Statistical Data Editing and Imputation". Wiley publication, 2011, p.16.
  8. 1 2 3 4 5 6 SCAD. "SCAD". SCAD. Retrieved 2020-12-07.
  9. Bethlehem, J. "Applied Survey Methods A Statistical Perspective ". Wiley publication, 2009, p.205.
  10. Waal, Ton de et al. "Handbook of Statistical Data Editing and Imputation". Wiley publication