Electoral history of Mike Pence

Last updated

Mike Pence ran his first political campaign in 1988 for Indiana's 2nd congressional district. A member of the Republican Party, he won his party's nomination, but lost the general election to incumbent Democratic representative Philip R. Sharp. A rematch occurred two years later and Pence lost by a bigger margin. In 2000, he made his third run for public office when he was finally elected to represent the same district. From 2002 to 2010, he comfortably won every election for Indiana's 6th congressional district.

Contents

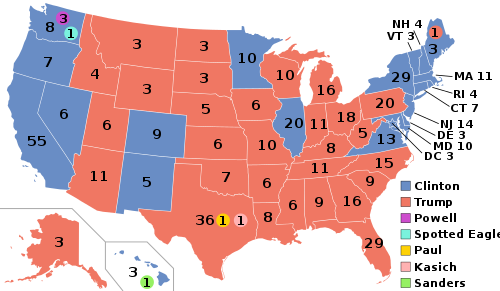
Forgoing another congressional campaign, Pence entered the 2012 Indiana gubernatorial election, winning the Republican nomination before narrowly defeating Democratic nominee John R. Gregg. Pence unanimously won his party's nomination in the 2016 gubernatorial election, but withdrew from the race after Republican nominee Donald Trump selected Pence as his running mate in their eventual Electoral College victory against the Democratic ticket of Hillary Clinton and Tim Kaine in the 2016 United States presidential election. In the 2020 presidential election, Trump and Pence lost to Democrats Joe Biden and Kamala Harris.

1988 Indiana's 2nd congressional district election

1988 Indiana's 2nd congressional district election [1]
PartyCandidateVotes%
Democratic Philip R. Sharp (incumbent) 116,915 53.20
Republican Mike Pence102,84646.80
Total votes219,761 100.00
Turnout 291,761

1990 Indiana's 2nd congressional district election

1990 Indiana's 2nd congressional district election [2]
PartyCandidateVotes%
Democratic Philip R. Sharp (incumbent) 93,495 59.37
Republican Mike Pence63,98040.63
Total votes157,475 100.00
Turnout 157,475

2000 Indiana's 2nd congressional district election

2000 Indiana's 2nd congressional district election [3]
PartyCandidateVotes%
Republican Mike Pence 106,023 50.87
Democratic Robert Rock80,88538.81
Independent Bill Frazier 19,0779.15
Libertarian Michael E. Anderson2,4221.16
Total votes208,407 100.00
Turnout 208,407

2002 Indiana's 6th congressional district election

2002 Indiana's 6th congressional district Republican Party primary [4]
PartyCandidateVotes%
Republican Mike Pence (incumbent) 55,142 100.00
Total votes55,142 100.00
Turnout 55,14222
2002 Indiana's 6th congressional district election [4]
PartyCandidateVotes%
Republican Mike Pence (incumbent) 118,436 63.79
Democratic Melina Ann Fox63,87134.40
Libertarian Doris Robertson3,3461.80
Total votes185,653 100.00
Turnout 185,65339
Republican hold

2004 Indiana's 6th congressional district election

2004 Indiana's 6th congressional district Republican Party primary [5]
PartyCandidateVotes%
Republican Mike Pence (incumbent) 61,794 100.00
Total votes61,794 100.00
2004 Indiana's 6th congressional district election [5]
PartyCandidateVotes%
Republican Mike Pence (incumbent) 182,529 67.09
Democratic Melina Ann Fox85,12331.29
Libertarian Chad (Wick) Roots4,3971.62
Total votes272,049 100.00
Turnout 272,04958
Republican hold

2006 Indiana's 6th congressional district election

2006 Indiana's 6th congressional district Republican Party primary [6]
PartyCandidateVotes%
Republican Mike Pence (incumbent) 52,188 86.13
Republican George Holland8,40613.87
Total votes60,594 100.00
Turnout 60,59419
2006 Indiana's 6th congressional district election [6]
PartyCandidateVotes%
Republican Mike Pence (incumbent) 115,266 60.01
Democratic Barry A. Welsh76,81239.99
Total votes192,078 100.00
Turnout 192,07840
Republican hold

2008 Indiana's 6th congressional district election

2008 Indiana's 6th congressional district Republican Party primary [7]
PartyCandidateVotes%
Republican Mike Pence (incumbent) 46,488 100.00
Total votes46,488 100.00
Turnout 46,48840
2008 Indiana's 6th congressional district election [7]
PartyCandidateVotes%
Republican Mike Pence (incumbent) 180,549 63.96
Democratic Barry A. Welsh94,22333.38
Libertarian George T. Holland7,5342.67
Total votes282,306 100.00
Turnout 282,30662
Republican hold

2010 Indiana's 6th congressional district election

2010 Indiana's 6th congressional district Republican Party primary [8]
PartyCandidateVotes%
Republican Mike Pence (incumbent) 61,381 100.00
Total votes61,381 100.00
Turnout 61,38121
2010 Indiana's 6th congressional district election [8]
PartyCandidateVotes%
Republican Mike Pence (incumbent) 126,027 66.57
Democratic Barry A. Welsh56,64729.92
Libertarian Talmage "T.J." Thompson, Jr.6,6353.51
Total votes189,309 100.00
Turnout 189,30941
Republican hold

2012 Indiana gubernatorial election

2012 Indiana Republican Party gubernatorial primary [9] [10]
PartyCandidateVotes%
Republican Mike Pence 554,412 100.00
Total votes554,412 100.00
Turnout 554,41222
2012 Indiana gubernatorial election [11] [12]
PartyCandidateVotes%±%
Republican Mike Pence / Sue Ellspermann 1,275,424 49.49%
Democratic John Gregg / Vi Simpson 1,200,01646.56%
Libertarian Rupert Boneham / Brad Klopfenstein101,8683.95%
No partyDonnie Harold Harris / George Fish (write-in)210%
Margin of victory75,4082.93%%
Turnout 2,577,32956.58%
Republican hold Swing

2016 Indiana gubernatorial election

2016 Indiana Republican Party gubernatorial primary [13] [14]
PartyCandidateVotes%
Republican Mike Pence (incumbent) 815,699 100
Total votes815,699 100
Turnout 815,69938

United States vice presidential elections

2016

Nomination

2016 Republican National Convention, vice presidential tally
CandidateVotes%
Mike Pence_ [a] 100.00
Total votes100.00

General election

Electoral college map of the 2016 election ElectoralCollege2016.svg
Electoral college map of the 2016 election
Electoral results
Presidential candidatePartyHome statePopular voteElectoral
vote
Running mate
CountPercentageVice-presidential candidateHome stateElectoral vote
Donald Trump Republican New York 62,984,82846.09%304 (306) Mike Pence Indiana 304 [b]
Hillary Clinton Democratic New York 65,853,51448.18%227 (232) Tim Kaine Virginia 227
Gary Johnson Libertarian New Mexico 4,489,3413.28%0 William Weld Massachusetts 0
Jill Stein Green Massachusetts 1,457,2181.07%0 Ajamu Baraka Illinois 0
Evan McMullin Independent Utah 731,9910.54%0 Mindy Finn District of Columbia 0
Darrell Castle Constitution Tennessee 203,0900.15%0 Scott Bradley Utah 0
Gloria La Riva Socialism and Liberation California 74,4010.05%0 Eugene Puryear District of Columbia 0
Tickets that received electoral votes from faithless electors
Bernie Sanders [c] Independent Vermont 111,850 [d] 0.08% [d] 1 (0) Elizabeth Warren [c] Massachusetts 1
John Kasich [c] [e] Republican Ohio 2,684 [d] 0.00% [d] 1 (0) Carly Fiorina [c] [e] Virginia 1
Ron Paul [c] [e] Libertarian [15] Texas 124 [d] 0.00% [d] 1 (0) Mike Pence Indiana 1
Colin Luther Powell [c] Republican Virginia 25 [d] 0.00% [d] 3 (0) Elizabeth Warren [c] Massachusetts 1
Maria Cantwell [c] Washington 1
Susan Collins [c] Maine 1
Faith Spotted Eagle [c] Democratic South Dakota 00.00%1 (0) Winona LaDuke [c] Minnesota 1
Other760,2100.56%Other
Total136,669,276100%538538
Needed to win270270

2020

Nomination

2020 Republican National Convention, vice presidential tally
CandidateVotes%
Mike Pence_ [a] 100.00
Total votes100.00

General election

Electoral college map of the 2020 election ElectoralCollege2020 with results.svg
Electoral college map of the 2020 election
Electoral results
Presidential candidatePartyHome statePopular voteElectoral
vote
Running mate
CountPercentageVice-presidential candidateHome stateElectoral vote
Joe Biden Democratic Delaware 81,283,50151.31%306 Kamala Harris California 306
Donald Trump
(incumbent)
Republican Florida 74,223,97546.85%232 Mike Pence
(incumbent)
Indiana 232
Jo Jorgensen Libertarian South Carolina 1,865,5351.18%0 Spike Cohen South Carolina 0
Howie Hawkins Green New York 407,0680.26%0 Angela Nicole Walker South Carolina 0
Rocky De La Fuente Reform California 301,0160.19%0 Darcy Richardson Florida 0
Other348,5360.22%Other
Total158,429,631100%538538
Needed to win270270

Presidential

2024 primary

Republican primary results2024 Republican Party presidential primaries [17]
PartyCandidateVotes%
Republican Donald Trump 17,015,756 76.42%
Republican Nikki Haley 4,381,79919.68%
Republican Ron DeSantis 353,6151.59%
N/A Uncommitted 154,8150.70%
Republican Chris Christie 139,5410.63%
Republican Vivek Ramaswamy 96,9540.44%
Republican Asa Hutchinson 22,0440.10%
Republican Perry Johnson 4,0510.02%
Republican Tim Scott 1,5980.01%
Republican Doug Burgum 5020.00%
Republican Mike Pence4040.00%
N/A Other candidates93,7960.42%
Total votes22,264,875 100.00%

Presidential write-ins

Pence received 535 write-in votes in the 2024 United States presidential election.

References

Notes:

  1. 1 2 Chosen by acclamation.
  2. Pence received 305 electoral votes for vice president, but only 304 as part of the Trump–Pence ticket; one faithless elector from Texas voted for Ron Paul as president instead of Trump, and is recorded separately below.
  3. 1 2 3 4 5 6 7 8 9 10 11 Received electoral vote(s) from a faithless elector
  4. 1 2 3 4 5 6 7 8 Candidate received votes as a write-in. The exact numbers of write-in votes have been published for three states: California, New Hampshire, and Vermont. [16]
  5. 1 2 3 Two faithless electors from Texas cast their presidential votes for Ron Paul and John Kasich, respectively. Chris Suprun said he cast his presidential vote for John Kasich and his vice presidential vote for Carly Fiorina. The other faithless elector in Texas, Bill Greene, cast his presidential vote for Ron Paul but cast his vice presidential vote for Mike Pence, as pledged. John Kasich received recorded write-in votes in Alabama, Georgia, Illinois, New Hampshire, North Carolina, Pennsylvania, and Vermont.
  1. Thomas, Richard C. (June 1989). "Election Results for the U.S. President, the U.S. Senate and the U.S. House of Representatives" (PDF). Federal Election Commission. Retrieved July 15, 2016.
  2. Thomas, Richard C. (April 1991). "Federal Elections 90 Election Results for the U.S. Senate and the U.S. House of Representatives" (PDF). Federal Election Commission. Retrieved July 15, 2016.
  3. "Statistics of the Presidential and Congressional Election of November 7, 2000" (PDF). Clerk of the U.S. House of Representatives. June 21, 2001. Retrieved December 13, 2016.
  4. 1 2 "2002 Indiana Election Report" (PDF). Indiana Election Division. pp. 7, 59, 67, 111. Archived from the original (PDF) on May 10, 2012. Retrieved March 11, 2017.
  5. 1 2 "2004 Indiana Election Report" (PDF). Indiana Election Division. pp. 14, 49, 78. Archived from the original (PDF) on February 23, 2017. Retrieved March 11, 2017.
  6. 1 2 "2006 Indiana Election Report" (PDF). Indiana Election Division. March 28, 2007. pp. 10, 62, 69–70, 110. Archived from the original (PDF) on October 25, 2012. Retrieved January 24, 2017.
  7. 1 2 "2008 Indiana Election Report" (PDF). Indiana Election Division. May 24, 2009. pp. 14, 56, 66–67, 104. Archived from the original (PDF) on January 15, 2021. Retrieved January 24, 2017.
  8. 1 2 "2010 Indiana Election Report" (PDF). Indiana Election Division. pp. 15, 61, 69, 111. Archived from the original (PDF) on February 23, 2017. Retrieved March 11, 2017.
  9. "Indiana Primary Election, May 8, 2012-United States Senator". Secretary of State of Indiana . June 5, 2012. Archived from the original on October 18, 2014. Retrieved June 11, 2012.
  10. "2012 Primary Election Turnout and Registration" (PDF). Indiana Secretary of State. May 8, 2012. Archived from the original (PDF) on February 27, 2017. Retrieved March 12, 2017.
  11. "Election Results". Indiana Secretary of State. November 28, 2012. Retrieved March 12, 2017.
  12. "2012 General Election Turnout and Registration" (PDF). Indiana Secretary of State. November 6, 2012. Archived from the original (PDF) on January 15, 2021. Retrieved March 12, 2017.
  13. "Indiana Primary Election, May 3, 2016". Indiana Secretary of State. Retrieved July 20, 2016.
  14. "2016 Primary Election Turnout and Registration" (PDF). Indiana Secretary of State. May 3, 2016. Archived from the original (PDF) on April 12, 2019. Retrieved March 12, 2017.
  15. Lau, Ryan (February 3, 2018). "Ron Paul Attacks Libertarian Leadership in Response to Controversy". 71Republic. Archived from the original on February 4, 2018. Retrieved February 3, 2018. I paid my lifetime membership, in 1987, with a gold coin, to make a point.
  16. CA: and NH: VT:
  17. "Republican Convention 2024". The Green Papers. Retrieved June 6, 2024.
    "Guam Presidential Caucus Election Results 2024". NBC News . March 20, 2024.
    "Missouri Presidential Caucus Election Results 2024". NBC News . April 2, 2024.
    "Oregon Republican". The Green Papers.
    "New Mexico Republican".
    "Montana Republican".
    "New Jersey Presidential Primary Election Results 2024". NBC News . July 21, 2024. Write-in vote totals are excluded from the above election data reporting for the following states, and are added to the total number of votes for candidates for the purposes of candidate vote share calculations: