Related Research Articles

An election is a formal group decision-making process by which a population chooses an individual or multiple individuals to hold public office.
Proportional representation (PR) refers to any type of electoral system under which subgroups of an electorate are reflected proportionately in the elected body. The concept applies mainly to political divisions among voters. The essence of such systems is that all votes cast – or almost all votes cast – contribute to the result and are effectively used to help elect someone – not just a bare plurality or (exclusively) the majority – and that the system produces mixed, balanced representation reflecting how votes are cast. In the context of voting systems, PR means that each representative in an assembly is elected by a roughly equal number of voters. In the common case of electoral systems that only allow a choice of parties, the seats are allocated in proportion to the vote share each party receives.

The 1792 United States presidential election was the second quadrennial presidential election. It was held from Friday, November 2, to Wednesday, December 5, 1792. Incumbent President George Washington was elected to a second term by a unanimous vote in the electoral college, while John Adams was re-elected as vice president. Washington was essentially unopposed, but Adams faced a competitive re-election against Governor George Clinton of New York.

The 1796 United States presidential election was the third quadrennial presidential election of the United States. It was held from Friday, November 4 to Wednesday, December 7, 1796. It was the first contested American presidential election, the first presidential election in which political parties played a dominant role, and the only presidential election in which a president and vice president were elected from opposing tickets. Incumbent vice president John Adams of the Federalist Party defeated former secretary of state Thomas Jefferson of the Democratic-Republican Party.

The 1800 United States presidential election was the fourth quadrennial presidential election. It was held from October 31 to December 3, 1800. In what is sometimes called the "Revolution of 1800", the Democratic-Republican Party candidate, Vice President Thomas Jefferson, defeated the Federalist Party candidate and incumbent, President John Adams. The election was a political realignment that ushered in a generation of Democratic-Republican leadership. This was the first presidential election in American history to be a rematch.

The 1872 United States presidential election was the 22nd quadrennial presidential election, held on Tuesday, November 5, 1872. Despite a split in the Republican Party, incumbent President Ulysses S. Grant defeated Democratic-endorsed Liberal Republican nominee Horace Greeley.
An electoral college is a set of electors who are selected to elect a candidate to particular offices. Often these represent different organizations, political parties or entities, with each organization, political party or entity represented by a particular number of electors or with votes weighted in a particular way. The United States has been the only democracy in the 21st century that still uses an electoral college to select its executive president. The other democracies that used an electoral college for these elections switched to direct elections in the 19th or 20th century.:215

In the United States, the Electoral College is the group of presidential electors that is formed every four years during the presidential election for the sole purpose of voting for the president and vice president. The process is described in Article II of the U.S. Constitution. The number of electoral votes a state has equals its number of Senators (2) plus its number of Representatives in the House of Representatives, the latter being dependent on the Census's reported population. Each state appoints electors using legal procedures determined by its legislature, equal in number to its congressional delegation totaling 535 electors in the 50 states. A 1961 amendment granted the federal District of Columbia three electors. Federal office holders, including senators and representatives, cannot be electors. Of the current 538 electors, a simple majority of 270 or more electoral votes is required to elect the president and vice president. If no candidate achieves a majority there, a contingent election is held by the House of Representatives to elect the president and by the Senate to elect the vice president.

In American politics, a swing state is any state that could reasonably be won by either the Democratic or Republican candidate in a statewide election, most often referring to presidential elections, by a swing in votes. These states are usually targeted by both major-party campaigns, especially in competitive elections. Meanwhile, the states that regularly lean to a single party are known as "safe states", as it is generally assumed that one candidate has a base of support from which a sufficient share of the electorate can be drawn without significant investment or effort by the campaign.

France is a unitary semi-presidential republic with a bicameral legislature. Public officials in the legislative and executive branches are either elected by the citizens or appointed by elected officials. Referenda may also be called to consult the French citizenry directly on a particular question, especially one which concerns amendment to the Constitution.
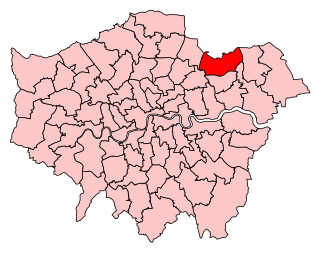
Ilford North is a constituency in Greater London that was created in 1945. The seat has been represented in the House of Commons of the Parliament of the United Kingdom by Wes Streeting of the Labour Party since 2015. Streeting currently serves as Secretary of State for Health and Social Care in the government of Keir Starmer.
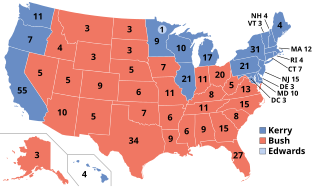
The 2004 United States presidential election was the 55th quadrennial presidential election, held on Tuesday, November 2, 2004. The Republican ticket of incumbent President George W. Bush and his running mate incumbent Vice President Dick Cheney were elected to a second term, defeating the Democratic ticket of John Kerry, a United States senator from Massachusetts and his running mate John Edwards, a United States senator from North Carolina.

Islington North is a constituency in Greater London established for the 1885 general election. It has been represented in the House of Commons of the UK Parliament since 1983 by Jeremy Corbyn, who was Leader of the Labour Party and Leader of the Opposition from 2015 to 2020. Since 2020, Corbyn has represented the seat as an independent, having been suspended for remarks he made after an investigation of antisemitism in the party, and ultimately was expelled from the party in 2024. He was re-elected to Islington North as an independent in the 2024 general election.

The 2016 United States presidential election was the 58th quadrennial presidential election, held on Tuesday, November 8, 2016. The Republican ticket, businessman Donald Trump and Indiana governor Mike Pence defeated the Democratic ticket of former secretary of state and First Lady of the United States Hillary Clinton and the junior senator from Virginia, Tim Kaine, in what was considered one of the biggest political upsets in American history. It was also the sixth and most recent presidential election in US History in which both major party candidates were registered in the same home state; the others have been in 1860, 1904, 1920, 1940, and 1944.

The election of the president and the vice president of the United States is an indirect election in which citizens of the United States who are registered to vote in one of the fifty U.S. states or in Washington, D.C., cast ballots not directly for those offices, but instead for members of the Electoral College. These electors then cast direct votes, known as electoral votes, for president, and for vice president. The candidate who receives an absolute majority of electoral votes is then elected to that office. If no candidate receives an absolute majority of the votes for president, the House of Representatives elects the president; likewise if no one receives an absolute majority of the votes for vice president, then the Senate elects the vice president.

There are five types of elections in the United Kingdom: elections to the House of Commons of the United Kingdom, elections to devolved parliaments and assemblies, local elections, mayoral elections, and police and crime commissioner elections. Within each of those categories, there may also be by-elections. Elections are held on Election Day, which is conventionally a Thursday, and under the provisions of the Dissolution and Calling of Parliament Act 2022 the timing of general elections can be held at the discretion of the prime minister during any five-year period. All other types of elections are held after fixed periods, though early elections to the devolved assemblies and parliaments can occur in certain situations. The five electoral systems used are: the single member plurality system (first-past-the-post), the multi-member plurality, the single transferable vote, the additional member system, and the supplementary vote.
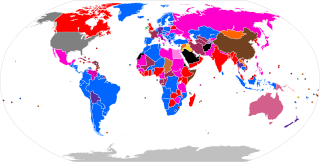
An electoral system or voting system is a set of rules that determine how elections and referendums are conducted and how their results are determined. Electoral systems are used in politics to elect governments, while non-political elections may take place in business, non-profit organisations and informal organisations. These rules govern all aspects of the voting process: when elections occur, who is allowed to vote, who can stand as a candidate, how ballots are marked and cast, how the ballots are counted, how votes translate into the election outcome, limits on campaign spending, and other factors that can affect the result. Political electoral systems are defined by constitutions and electoral laws, are typically conducted by election commissions, and can use multiple types of elections for different offices.

The 2020 United States presidential election was the 59th quadrennial presidential election, held on Tuesday, November 3, 2020. The Democratic ticket of former vice president Joe Biden and the junior U.S. senator from California Kamala Harris defeated the incumbent Republican president, Donald Trump, and vice president, Mike Pence. The election took place against the backdrop of the global COVID-19 pandemic and related recession. The election saw the highest voter turnout by percentage since 1900, with each of the two main tickets receiving more than 74 million votes, surpassing Barack Obama's record of 69.5 million votes from 2008. Biden received more than 81 million votes, the most votes ever cast for a candidate in a U.S. presidential election.

Since being admitted to the Union in 1850, California has participated in 43 presidential elections. A bellwether from 1888 to 1996, voting for the losing candidates only three times in that span, California has become a reliable state for Democratic presidential candidates since 1992.
This is a list of electoral district results for the 2019 New South Wales state election.
References
- ↑ Green, Antony. "Results of the 2005 WA Election" (PDF). ABC Election Archives.