Related Research Articles

The Stirling council area is one of the 32 council areas of Scotland, and has a population of about 92,530. It was created in 1975 as a lower-tier district within the Central region. The district covered parts of the historic counties of Stirlingshire and Perthshire, which were abolished for local government purposes. In 1996 the Central region was abolished and Stirling Council took over all local government functions within the area.
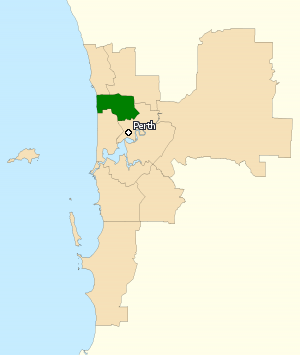
The Division of Stirling was an Australian electoral division in the inner northern and beachside suburbs of Perth, Western Australia, which included a large portion of the local government area of the City of Stirling.

The Division of Cowan is an Australian Electoral Division in Western Australia.

Stirling was a county constituency of the House of Commons of the Parliament of the United Kingdom. It elected one Member of Parliament (MP) by the first past the post system of election.
West Stirlingshire was a county constituency of the House of Commons of the Parliament of the United Kingdom, to which it elected one Member of Parliament (MP) by the first past the post electoral system.

Kirkcaldy is a constituency of the Scottish Parliament (Holyrood). It elects one Member of the Scottish Parliament (MSP) by the plurality method of election. Also, it is one of nine constituencies in the Mid Scotland and Fife electoral region, which elects seven additional members, in addition to nine constituency MSPs, to produce a form of proportional representation for the region as a whole.

North East Fife is a constituency of the Scottish Parliament (Holyrood) covering part of the council area of Fife. It elects one Member of the Scottish Parliament (MSP) by the plurality method of election. It is additionally one of nine constituencies in the Mid Scotland and Fife electoral region, which elects seven additional members, in addition to the nine constituency MSPs, to produce a form of proportional representation for the region as a whole.

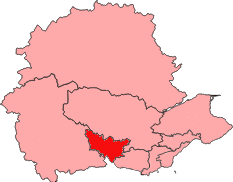
Stirling is a constituency of the Scottish Parliament (Holyrood) covering part of the council area of Stirling. It elects one Member of the Scottish Parliament (MSP) by the plurality method of election. It is one of nine constituencies in the Mid Scotland and Fife electoral region, which elects seven additional members, in addition to the nine constituency MSPs, to produce a form of proportional representation for the region as a whole.
Stirling was an electoral district of the Legislative Assembly in the Australian state of Western Australia from 1950 to 2008.

Warren-Blackwood is an electoral district of the Legislative Assembly in the Australian state of Western Australia from 1950 to 2008, and from 2013 onwards.
Scottish Voice was a Scottish centre-right political party, launched in February 2007 by Archie Stirling, a wealthy businessman and landowner. The party headquarters were at Craigarnhall, by the town of Bridge of Allan, in the historical parish of Lecropt.
Blackwood-Stirling was an electoral district of the Legislative Assembly in the Australian state of Western Australia. It took parts of the South West and Great Southern regions of Western Australia.
Clackmannanshire and Dunblane is a constituency of the Scottish Parliament (Holyrood) covering part of the Stirling council area and the entirety of Clackmannanshire. It elects one Member of the Scottish Parliament (MSP) by the plurality method of election. It is one of nine constituencies in the Mid Scotland and Fife electoral region, which elects seven additional members, in addition to the nine constituency MSPs, to produce a form of proportional representation for the region as a whole. Created in 2011, the constituency covers much of the area previously in the abolished Ochil constituency.

Mid Fife and Glenrothes is a constituency of the Scottish Parliament (Holyrood) covering part of the council area of Fife. It elects one Member of the Scottish Parliament (MSP) by the plurality method of election. It is one of nine constituencies in the Mid Scotland and Fife electoral region, which elects seven additional members, in addition to the nine constituency MSPs, to produce a form of proportional representation for the region as a whole. Created in 2011, the constituency comprises most of the previous Central Fife constituency which was abolished for the 2011 Scottish Parliament election.

Dunfermline is a constituency of the Scottish Parliament (Holyrood) covering part of the council area of Fife. It elects one Member of the Scottish Parliament (MSP) by the plurality method of election. It is one of nine constituencies in the Mid Scotland and Fife electoral region, which elects seven additional members, in addition to the nine constituency MSPs, to produce a form of proportional representation for the region as a whole.

Cowdenbeath is a constituency of the Scottish Parliament (Holyrood) covering part of the council area of Fife. It elects one Member of the Scottish Parliament (MSP) by the plurality method of election. It is one of nine constituencies in the Mid Scotland and Fife electoral region, which elects seven additional members, in addition to the nine constituency MSPs, to produce a form of proportional representation for the region as a whole.
This is a list of electoral results for the Division of Stirling in Australian federal elections from the division's creation in 1955 until 2019. The division was abolished in 2022.
This is a list of electoral results for the electoral district of Blackwood-Stirling in Western Australian state elections.

2022 Elections to Stirling Council were held on 5 May 2022, the same day as the 31 other local authorities in Scotland. The election used the seven wards created under the Local Governance (Scotland) Act 2004, with 23 councillors being elected. Each ward elected either 3 or 4 members, using the STV electoral system.

The 2022 Australian federal election in the Senate was held on 21 May 2022 to elect 40 of the 76 senators in the Australian Senate, after a six-week campaign. Senators elected at this election took office on 1 July 2022, with the exception of the Senators elected from two territories whose terms commenced from election day. The elected senators sit alongside continuing senators elected in 2019 as part of the 47th Parliament of Australia.
References
- ↑ Green, Antony. "Results of the 2005 WA Election" (PDF). ABC Election Archives.