This is a list of electoral results for the Electoral district of West Perth in Western Australian state elections.
Member | Party | Term | |
---|---|---|---|
Timothy Quinlan | Non-aligned | 1890–1894 | |
Barrington Wood | Ministerialist | 1894–1901 | |
George Leake | Oppositionist | 1901–1902 | |
Charles Moran | Independent | 1902–1905 | |
Frederick Illingworth | Ministerialist | 1905–1907 | |
Thomas Draper | Ministerialist | 1907–1911 | |
Eben Allen | Liberal | 1911–1917 | |
Thomas Draper | Nationalist | 1917–1921 | |
Edith Cowan | Nationalist | 1921–1924 | |
Thomas Davy | Nationalist | 1924–1933 | |
Robert Ross McDonald | Nationalist | 1933–1945 | |
Liberal | 1945–1949 | ||
Liberal Country League | 1949–1950 | ||
Joseph Totterdell | Liberal Country League | 1950–1953 | |
Stanley Heal | Labor | 1953–1962 |
Party | Candidate | Votes | % | ±% | |
---|---|---|---|---|---|
Labor | Stanley Heal | 3,421 | 50.7 | −7.1 | |
Liberal and Country | Raymond Nowland | 3,322 | 49.3 | +7.1 | |
Total formal votes | 6,743 | 97.9 | +0.6 | ||
Informal votes | 145 | 2.1 | −0.6 | ||
Turnout | 6,888 | 87.9 | −0.8 | ||
Labor hold | Swing | -7.1 | |||
Party | Candidate | Votes | % | ±% | |
---|---|---|---|---|---|
Labor | Stanley Heal | 4,385 | 57.8 | ||
Liberal and Country | Raymond Nowland | 3,206 | 42.2 | ||
Total formal votes | 7,591 | 97.3 | |||
Informal votes | 212 | 2.7 | |||
Turnout | 7,803 | 88.7 | |||
Labor hold | Swing | ||||
Party | Candidate | Votes | % | ±% | |
---|---|---|---|---|---|
Labor | Stanley Heal | 3,665 | 52.4 | +10.8 | |
Liberal and Country | Joseph Totterdell | 3,333 | 47.6 | −5.3 | |
Total formal votes | 6,998 | 98.1 | +0.7 | ||
Informal votes | 132 | 1.9 | −0.7 | ||
Turnout | 7,130 | 91.9 | +3.5 | ||
Labor gain from Liberal and Country | Swing | +8.1 | |||
Party | Candidate | Votes | % | ±% | |
---|---|---|---|---|---|
Liberal and Country | Joseph Totterdell | 4,355 | 52.9 | ||
Labor | Lucien Triat | 3,425 | 41.6 | ||
Independent | Frederick Swaine | 448 | 5.4 | ||
Total formal votes | 8,228 | 97.4 | |||
Informal votes | 216 | 2.6 | |||
Turnout | 8,444 | 88.4 | |||
Two-party-preferred result | |||||
Liberal and Country | Joseph Totterdell | 55.7 | |||
Labor | Lucien Triat | 44.3 | |||
Liberal and Country hold | Swing | ||||
Party | Candidate | Votes | % | ±% | |
---|---|---|---|---|---|
Liberal | Robert McDonald | unopposed | |||
Liberal hold | Swing | ||||
Party | Candidate | Votes | % | ±% | |
---|---|---|---|---|---|
Nationalist | Robert McDonald | 3,168 | 53.8 | −9.0 | |
Labor | William Beadle | 2,723 | 46.2 | +9.0 | |
Total formal votes | 5,891 | 97.7 | −0.2 | ||
Informal votes | 139 | 2.3 | +0.2 | ||
Turnout | 6,030 | 84.0 | −5.4 | ||
Nationalist hold | Swing | -9.0 | |||
Party | Candidate | Votes | % | ±% | |
---|---|---|---|---|---|
Nationalist | Robert McDonald | 3,691 | 62.8 | +7.8 | |
Labor | Roy Nevile | 2,183 | 37.2 | −7.8 | |
Total formal votes | 5,874 | 97.9 | −1.2 | ||
Informal votes | 126 | 2.1 | +1.2 | ||
Turnout | 6,000 | 89.4 | +20.0 | ||
Nationalist hold | Swing | +7.8 | |||
Party | Candidate | Votes | % | ±% | |
---|---|---|---|---|---|
Nationalist | Robert McDonald | 2,595 | 55.0 | +15.7 | |
Labor | William Beadle | 2,122 | 45.0 | −0.8 | |
Total formal votes | 4,717 | 99.1 | +1.0 | ||
Informal votes | 45 | 0.9 | −1.0 | ||
Turnout | 4,762 | 69.4 | −21.7 | ||
Nationalist hold | Swing | +4.2 | |||
Party | Candidate | Votes | % | ±% | |
---|---|---|---|---|---|
Labor | John Blair | 2,738 | 45.8 | +1.7 | |
Nationalist | Robert McDonald | 2,349 | 39.3 | −16.6 | |
Ind. Nationalist | Leonard Goold | 549 | 9.2 | +9.2 | |
Ind. Nationalist | Frank Cato | 345 | 5.8 | +5.8 | |
Total formal votes | 5,981 | 98.1 | −1.0 | ||
Informal votes | 117 | 1.9 | +1.0 | ||
Turnout | 6,098 | 91.1 | +13.0 | ||
Two-party-preferred result | |||||
Nationalist | Robert McDonald | 3,041 | 50.8 | −5.1 | |
Labor | John Blair | 2,940 | 49.2 | +5.1 | |
Nationalist hold | Swing | -5.1 | |||
Party | Candidate | Votes | % | ±% | |
---|---|---|---|---|---|
Nationalist | Thomas Davy | 2,884 | 55.9 | ||
Labor | Frank Darcey | 2,277 | 44.1 | ||
Total formal votes | 5,114 | 99.1 | |||
Informal votes | 47 | 0.9 | |||
Turnout | 5,208 | 78.1 | |||
Nationalist hold | Swing | ||||
Party | Candidate | Votes | % | ±% | |
---|---|---|---|---|---|
Nationalist | Thomas Davy | 1,766 | 44.4 | +9.6 | |
Labor | Alexander McDougall | 1,405 | 35.4 | +1.1 | |
Women's Electoral League | Edith Cowan | 803 | 20.2 | +20.2 | |
Total formal votes | 3,974 | 97.5 | −1.7 | ||
Informal votes | 101 | 2.5 | +1.7 | ||
Turnout | 4,075 | 76.2 | +11.4 | ||
Two-party-preferred result | |||||
Nationalist | Thomas Davy | 2,400 | 60.4 | −0.4 | |
Labor | Alexander McDougall | 1,574 | 39.6 | +0.4 | |
Nationalist hold | Swing | -0.4 | |||
Party | Candidate | Votes | % | ±% | |
---|---|---|---|---|---|
Nationalist | Thomas Davy | 1,250 | 34.8 | +34.8 | |
Labor | Alexander McDougall | 1,233 | 34.3 | +34.3 | |
Nationalist | Edith Cowan | 1,108 | 30.8 | −7.5 | |
Total formal votes | 3,561 | 99.2 | +0.7 | ||
Informal votes | 30 | 0.8 | −0.7 | ||
Turnout | 3,621 | 64.8 | −4.5 | ||
Two-party-preferred result | |||||
Nationalist | Thomas Davy | 2,182 | 60.8 | ||
Labor | Alexander McDougall | 1,409 | 39.2 | ||
Nationalist hold | Swing | N/A | |||
Party | Candidate | Votes | % | ±% | |
---|---|---|---|---|---|
Nationalist | Edith Cowan | 1,164 | 38.3 | +38.3 | |
Nationalist | Thomas Draper | 1,109 | 36.5 | −16.8 | |
Nationalist | Ebenezer Allen | 767 | 25.2 | +25.2 | |
Total formal votes | 3,040 | 98.5 | +3.1 | ||
Informal votes | 45 | 1.5 | −3.1 | ||
Turnout | 3,085 | 69.3 | +8.0 | ||
Two-candidate-preferred result | |||||
Nationalist | Edith Cowan | 1,543 | 50.8 | ||
Nationalist | Thomas Draper | 1,497 | 49.2 | ||
Nationalist hold | Swing | N/A | |||
Party | Candidate | Votes | % | ±% | |
---|---|---|---|---|---|
Nationalist | Thomas Draper | 1,525 | 53.3 | +53.3 | |
National Liberal | Ebenezer Allen | 1,159 | 40.5 | –23.1 | |
National Liberal | Joseph East | 178 | 6.2 | +6.2 | |
Total formal votes | 2,862 | 95.4 | –4.3 | ||
Informal votes | 139 | 4.6 | +4.3 | ||
Turnout | 3,001 | 61.3 | +13.0 | ||
Nationalist hold | Swing | N/A | |||
Party | Candidate | Votes | % | ±% | |
---|---|---|---|---|---|
Liberal | Eben Allen | 2,288 | 63.6 | +30.2 | |
Labor | James Doland | 1,308 | 36.4 | −7.6 | |
Total formal votes | 3,596 | 99.7 | +1.1 | ||
Informal votes | 9 | 0.3 | −1.1 | ||
Turnout | 3,605 | 48.3 | −33.9 | ||
Liberal hold | Swing | +9.1 | |||
Party | Candidate | Votes | % | ±% | |
---|---|---|---|---|---|
Labor | Walter Simpson | 1,608 | 44.0 | ||
Ministerialist | Eben Allen | 1,219 | 33.4 | ||
Ministerialist | Richard Vincent | 825 | 22.6 | ||
Total formal votes | 3,652 | 98.6 | |||
Informal votes | 52 | 1.4 | |||
Turnout | 3,704 | 82.2 | |||
Two-party-preferred result | |||||
Ministerialist | Eben Allen | 1,991 | 54.5 | ||
Labor | Walter Simpson | 1,661 | 45.5 | ||
Ministerialist hold | Swing | ||||
Party | Candidate | Votes | % | ±% | |
---|---|---|---|---|---|
Ministerialist | Thomas Draper | 1,401 | 54.7 | −10.7 | |
Ministerialist | Walter Simpson | 1,161 | 45.3 | +45.3 | |
Total formal votes | 2,562 | 99.6 | +1.2 | ||
Informal votes | 9 | 0.4 | −1.2 | ||
Turnout | 2,571 | 66.0 | +16.8 | ||
Ministerialist hold | Swing | N/A | |||
Party | Candidate | Votes | % | ±% | |
---|---|---|---|---|---|
National Political League | Thomas Draper | 1,433 | 57.4 | +57.4 | |
Ministerialist | Walter Simpson | 1,064 | 42.6 | +42.6 | |
Total formal votes | 2,497 | 99.4 | +1.0 | ||
Informal votes | 16 | 0.6 | −1.0 | ||
Turnout | 2,513 | 65.4 | +16.2 | ||
National Political League hold | Swing | N/A | |||
Party | Candidate | Votes | % | ±% | |
---|---|---|---|---|---|
Ministerialist | Frederick Illingworth | 1,276 | 65.4 | +65.4 | |
Ministerialist | James Speed | 655 | 33.6 | +33.6 | |
Labour | Robert Norman | 21 | 1.1 | –23.1 | |
Total formal votes | 1,952 | 98.4 | ±0 | ||
Informal votes | 32 | 1.6 | ±0 | ||
Turnout | 1,984 | 49.2 | +9.7 | ||
Ministerialist hold | Swing | N/A | |||
Party | Candidate | Votes | % | ±% | |
---|---|---|---|---|---|
Independent | Charles Moran | 1,064 | 38.2 | +6.4 | |
Labour | Robert Norman | 1,049 | 37.6 | +11.7 | |
Ministerialist | Walter Simpson | 676 | 24.2 | +24.2 | |
Total formal votes | 2,789 | 98.4 | +1.5 | ||
Informal votes | 44 | 1.6 | –1.5 | ||
Turnout | 2,833 | 39.5 | n/a | ||
Independent hold | Swing | +6.4 | |||
Party | Candidate | Votes | % | ±% | |
---|---|---|---|---|---|
Independent | Charles Moran | 495 | 31.9 | +31.9 | |
Labour | Fred Gill | 402 | 25.9 | +25.9 | |
Independent | John Phair | 263 | 16.9 | +16.9 | |
Opposition | Alfred Russell | 169 | 10.9 | +10.9 | |
Anti Early Closing Association | Thomas Molloy | 153 | 9.9 | +9.9 | |
Opposition | John Brickhill | 71 | 4.6 | +4.6 | |
Total formal votes | 1,553 | 96.9 | −1.4 | ||
Informal votes | 50 | 3.1 | +1.4 | ||
Turnout | 1,603 | N/A | N/A | ||
Independent gain from Opposition | Swing | N/A | |||
Party | Candidate | Votes | % | ±% | |
---|---|---|---|---|---|
Opposition | George Leake | 886 | 51.7 | +51.7 | |
Ministerialist | Barrington Wood | 828 | 48.3 | –5.6 | |
Total formal votes | 1,714 | 98.7 | +0.4 | ||
Informal votes | 22 | 1.3 | –0.4 | ||
Turnout | 1,736 | 46.8 | +2.3 | ||
Opposition gain from Ministerialist | Swing | +51.7 | |||
Party | Candidate | Votes | % | ±% | |
---|---|---|---|---|---|
Ministerialist | Barrington Wood | 411 | 53.9 | ||
Ministerialist | Thomas Molloy | 260 | 34.1 | ||
Opposition | Robert Knox-Peden | 91 | 11.9 | ||
Total formal votes | 762 | 98.3 | |||
Informal votes | 13 | 1.7 | |||
Turnout | 775 | 44.5 | |||
Ministerialist hold | Swing | ||||
Party | Candidate | Votes | % | ±% | |
---|---|---|---|---|---|
National Education | Barrington Wood | 398 | 42.1 | +42.1 | |
Education Defence | Timothy Quinlan | 379 | 40.1 | –11.7 | |
None | Richard Haynes | 169 | 17.9 | –29.3 | |
Party | Candidate | Votes | % | ±% | |
---|---|---|---|---|---|
None | Timothy Quinlan | 249 | 52.8 | n/a | |
None | Richard Haynes | 223 | 47.2 | n/a | |
The Western Australian Legislative Assembly, or lower house, is one of the two chambers of the Parliament of Western Australia, an Australian state. The Parliament sits in Parliament House in the Western Australian capital, Perth.
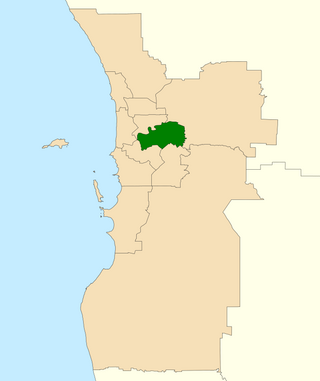
The Division of Swan is an Australian electoral division located in Western Australia.
The Western Australian Legislative Council is the upper house of the Parliament of Western Australia, a state of Australia. It is regarded as a house of review for legislation passed by the Legislative Assembly, the lower house. The two Houses of Parliament sit in Parliament House in the state capital, Perth.
The Western Australian Legislative Assembly is elected from 59 single-member electoral districts. These districts are often referred to as electorates or seats.
The Division of Perth is an Australian electoral division in the state of Western Australia. It is named after Perth, the capital city of Western Australia, where the Division is located.
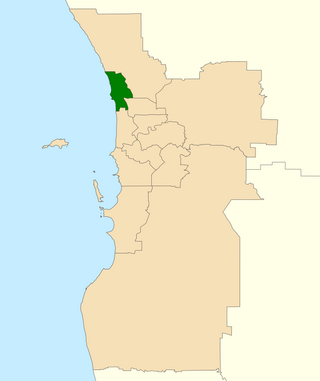
The Division of Moore is an Australian electoral division in the state of Western Australia.
Alfred Cove was an electoral district of the Legislative Assembly of Western Australia. It was located in Perth's southern suburbs, and named after the riverside suburb of Alfred Cove.
Churchlands is a Legislative Assembly electorate in the state of Western Australia. Churchlands is named for the western suburb of Churchlands, which falls within its borders, and was created at the 1994 redistribution, replacing the seat of Floreat which had existed since 1968.
Cottesloe is a Legislative Assembly electorate in the state of Western Australia. Cottesloe is named for the western Perth suburb of Cottesloe, which falls within its borders. Its previous member, Colin Barnett, was the 29th Premier of Western Australia. The current member, David Honey, was elected in a by-election after Barnett resigned in 2018.
Nedlands is a Legislative Assembly electorate in the state of Western Australia. Nedlands is named for the inner western Perth suburb of Nedlands, which falls within its borders.
The electoral district of Perth is a Legislative Assembly electorate in the state of Western Australia. Perth is named for the capital city of Western Australia whose central business district falls within its borders. It is one of the oldest electorates in Western Australia, with its first member having been elected in the inaugural 1890 elections of the Legislative Assembly.
The lower houses of the parliaments of the states and territories of Australia are divided into electoral districts. Most electoral districts send a single member to a state or territory's parliament using the preferential method of voting. The area of a state electoral district is dependent upon the Electoral Acts in the various states and vary in area between them. At present, there are 409 state electoral districts in Australia.
This is a list of results for the electoral district of Perth in Western Australian state elections from the district's creation in 1890 until the present.
The electoral district of Canning was an electorate in the state of Western Australia. The electorate, which was named for the Canning River which ran through it, was first contested at the 1897 election, but was abolished prior to the 1901 election, with most of its territory transferred to the new seat of South Perth. However, for the 1904 election, South Perth was abolished and Canning re-created. Canning was abolished for a second time in the 1988 redistribution.
Mount Lawley is an electorate in the state of Western Australia. Mount Lawley is named for the inner north-eastern Perth suburb of Mount Lawley, which falls within its borders.
This is a list of electoral results for the Electoral district of Marangaroo in Western Australian state elections from 1989 to 1996. The district was based in Perth's northern suburbs. It was a safe Labor seat.
The 2021 Western Australian state election was held on Saturday, March 13, to elect members to the Parliament of Western Australia, where all 59 seats in the Legislative Assembly and all 36 seats in the Legislative Council were up for election.
This is a list of electoral results for the electoral district of Mount Marshall in Western Australian state elections.
This is a list of electoral results for the Electoral district of East Perth in Western Australian state elections.
This is a list of electoral results for the Electoral district of North Perth in Western Australian state elections.