This is a list of electoral results for the Electoral district of Boulder in Western Australian state elections.
Boulder (1901–1962) | |||
---|---|---|---|
Member | Party | Term | |
John Hopkins | Ministerial | 1901–1905 | |
Philip Collier | Labor | 1905–1948 | |
Charlie Oliver | Labor | 1948–1951 | |
Arthur Moir | Labor | 1951–1962 | |
Boulder-Eyre (1962–1968) | |||
Arthur Moir | Labor | 1962–1968 | |
Boulder-Dundas (1968–1977) | |||
Arthur Moir | Labor | 1968–1971 | |
Tom Hartrey | Labor | 1971–1977 | |
Party | Candidate | Votes | % | ±% | |
---|---|---|---|---|---|
Labor | Tom Hartrey | 3,770 | 61.8 | ||
Liberal | Eric Bingley | 1,751 | 28.7 | ||
National Alliance | John Madden | 584 | 9.6 | ||
Total formal votes | 6,105 | 92.2 | |||
Informal votes | 519 | 7.8 | |||
Turnout | 6,624 | 86.4 | |||
Two-party-preferred result | |||||
Labor | Tom Hartrey | 3,858 | 63.2 | ||
Liberal | Eric Bingley | 2,247 | 36.8 | ||
Labor hold | Swing | ||||
Party | Candidate | Votes | % | ±% | |
---|---|---|---|---|---|
Labor | Tom Hartrey | 4,202 | 75.8 | −24.2 | |
Independent | Kevin Merriman | 749 | 13.5 | +13.5 | |
Democratic Labor | John Madden | 595 | 10.7 | +10.7 | |
Total formal votes | 5,546 | 96.3 | |||
Informal votes | 214 | 3.7 | |||
Turnout | 5,760 | 87.7 | |||
Two-candidate-preferred result | |||||
Labor | Tom Hartrey | 4,351 | 78.5 | −21.5 | |
Independent | Kevin Merriman | 1,195 | 21.5 | +21.5 | |
Labor hold | Swing | N/A | |||
Party | Candidate | Votes | % | ±% | |
---|---|---|---|---|---|
Labor | Arthur Moir | unopposed | |||
Labor hold | Swing | ||||
Party | Candidate | Votes | % | ±% | |
---|---|---|---|---|---|
Labor | Arthur Moir | unopposed | |||
Labor hold | Swing | ||||
Party | Candidate | Votes | % | ±% | |
---|---|---|---|---|---|
Labor | Arthur Moir | 3,170 | 62.1 | ||
Liberal and Country | Philip Charsley | 1,161 | 22.7 | ||
Independent | Orlando Stuart | 389 | 7.6 | ||
Country | William Kirwan | 385 | 7.5 | ||
Total formal votes | 5,105 | 98.4 | |||
Informal votes | 81 | 1.6 | |||
Turnout | 5,186 | 92.0 | |||
Two-party-preferred result | |||||
Labor | Arthur Moir | 66.7 | |||
Liberal and Country | Philip Charsley | 33.3 | |||
Labor hold | Swing | ||||
Party | Candidate | Votes | % | ±% | |
---|---|---|---|---|---|
Labor | Arthur Moir | unopposed | |||
Labor hold | Swing | ||||
Party | Candidate | Votes | % | ±% | |
---|---|---|---|---|---|
Labor | Arthur Moir | unopposed | |||
Labor hold | Swing | ||||
Party | Candidate | Votes | % | ±% | |
---|---|---|---|---|---|
Labor | Arthur Moir | unopposed | |||
Labor hold | Swing | ||||
Party | Candidate | Votes | % | ±% | |
---|---|---|---|---|---|
Labor | Arthur Moir | unopposed | |||
Labor hold | Swing | ||||
Party | Candidate | Votes | % | ±% | |
---|---|---|---|---|---|
Labor | Charlie Oliver | unopposed | |||
Labor hold | Swing | ||||
Party | Candidate | Votes | % | ±% | |
---|---|---|---|---|---|
Labor | Charlie Oliver | 2,399 | 78.9 | –21.1 | |
Liberal | Billy Snedden | 553 | 18.2 | +18.2 | |
Justice and Liberty Liberal | James Collins | 87 | 2.9 | +2.9 | |
Total formal votes | 3,039 | 98.3 | n/a | ||
Informal votes | 53 | 1.7 | n/a | ||
Turnout | 3,092 | 87.4 | n/a | ||
Labor hold | Swing | n/a | |||
Party | Candidate | Votes | % | ±% | |
---|---|---|---|---|---|
Labor | Philip Collier | unopposed | |||
Labor hold | Swing | ||||
Party | Candidate | Votes | % | ±% | |
---|---|---|---|---|---|
Labor | Philip Collier | unopposed | |||
Labor hold | Swing | ||||
Party | Candidate | Votes | % | ±% | |
---|---|---|---|---|---|
Labor | Philip Collier | 2,039 | 61.6 | −38.4 | |
Independent | Walter Coath | 961 | 29.1 | +29.1 | |
Communist | Wilfred Mountjoy | 308 | 9.3 | +9.3 | |
Total formal votes | 3,308 | 98.2 | |||
Informal votes | 62 | 1.8 | |||
Turnout | 3,370 | 95.1 | |||
Labor hold | Swing | N/A | |||
Party | Candidate | Votes | % | ±% | |
---|---|---|---|---|---|
Labor | Philip Collier | unopposed | |||
Labor hold | Swing | ||||
Party | Candidate | Votes | % | ±% | |
---|---|---|---|---|---|
Labor | Philip Collier | 2,337 | 89.5 | −10.5 | |
Communist | Wilfred Mountjoy | 274 | 10.5 | +10.5 | |
Total formal votes | 2,611 | 96.7 | |||
Informal votes | 89 | 3.3 | |||
Turnout | 2,700 | 92.1 | |||
Labor hold | Swing | N/A | |||
Party | Candidate | Votes | % | ±% | |
---|---|---|---|---|---|
Labor | Philip Collier | unopposed | |||
Labor hold | Swing | ||||
Party | Candidate | Votes | % | ±% | |
---|---|---|---|---|---|
Labor | Philip Collier | unopposed | |||
Labor hold | Swing | ||||
Party | Candidate | Votes | % | ±% | |
---|---|---|---|---|---|
Labor | Philip Collier | unopposed | |||
Labor hold | Swing | ||||
Party | Candidate | Votes | % | ±% | |
---|---|---|---|---|---|
Labor | Philip Collier | 1,833 | 54.5 | −3.9 | |
National Labor | James Rogers | 1,533 | 45.5 | +3.9 | |
Total formal votes | 3,366 | 99.5 | −0.1 | ||
Informal votes | 16 | 0.5 | +0.1 | ||
Turnout | 3,382 | 84.4 | +12.4 | ||
Labor hold | Swing | -3.9 | |||
Party | Candidate | Votes | % | ±% | |
---|---|---|---|---|---|
Labor | Philip Collier | 2,013 | 58.4 | –41.6 | |
National Labor | James Reed | 1,435 | 41.6 | +41.6 | |
Total formal votes | 3,448 | 99.7 | n/a | ||
Informal votes | 12 | 0.3 | n/a | ||
Turnout | 3,460 | 72.0 | n/a | ||
Labor hold | Swing | –41.6 | |||
Party | Candidate | Votes | % | ±% | |
---|---|---|---|---|---|
Labor | Philip Collier | unopposed | |||
Labor hold | Swing | ||||
Party | Candidate | Votes | % | ±% | |
---|---|---|---|---|---|
Labor | Philip Collier | unopposed | |||
Labor hold | Swing | ||||
Party | Candidate | Votes | % | ±% | |
---|---|---|---|---|---|
Labour | Philip Collier | 1,798 | 73.1 | +26.3 | |
Ministerialist | James Johnston | 661 | 26.9 | −18.8 | |
Total formal votes | 2,459 | 97.2 | −2.4 | ||
Informal votes | 71 | 2.8 | +2.4 | ||
Turnout | 2,530 | 75.8 | +6.7 | ||
Labour hold | Swing | N/A | |||
Party | Candidate | Votes | % | ±% | |
---|---|---|---|---|---|
Labour | Philip Collier | 872 | 46.8 | +8.3 | |
Ministerialist | John Hopkins | 853 | 45.7 | –15.8 | |
Independent | William Rabbish | 140 | 7.5 | +7.5 | |
Total formal votes | 1,865 | 99.6 | –0.1 | ||
Informal votes | 8 | 0.4 | +0.1 | ||
Turnout | 1,880 | 69.1 | +9.0 | ||
Labour gain from Ministerialist | Swing | +8.3 | |||
Party | Candidate | Votes | % | ±% | |
---|---|---|---|---|---|
Ministerialist | John Hopkins | 1,327 | 61.5 | +5.3 | |
Labour | Michael McCarthy | 830 | 38.5 | +1.5 | |
Total formal votes | 2,157 | 99.7 | +0.7 | ||
Informal votes | 6 | 0.3 | –0.7 | ||
Turnout | 2,157 | 60.1 | +4.2 | ||
Ministerialist hold | Swing | +5.3 | |||
Party | Candidate | Votes | % | ±% | |
---|---|---|---|---|---|
Opposition | John Hopkins | 628 | 56.2 | +56.2 | |
Labour | George Wiles | 414 | 37.0 | +37.0 | |
Opposition | John Keegan | 76 | 6.8 | +6.8 | |
Total formal votes | 1,118 | 99.0 | n/a | ||
Informal votes | 11 | 1.0 | n/a | ||
Turnout | 1,129 | 55.9 | n/a | ||
Opposition win | (new seat) | ||||
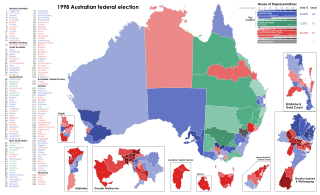
The 1998 Australian federal election was held to determine the members of the 39th Parliament of Australia. It was held on 3 October 1998. All 148 seats of the House of Representatives and 40 seats of the 76-seat Senate were up for election. The incumbent centre-right Liberal/National Coalition government led by Prime Minister John Howard of the Liberal Party and coalition partner Tim Fischer of the National Party defeated the centre-left Australian Labor Party opposition led by Opposition Leader Kim Beazley, despite losing the nationwide popular and two-party preferred vote. However, the Australian Labor Party gained seats from the previous election.
The Division of Canning is an Australian Electoral Division in Western Australia.
The Electoral district of Brown Hill-Ivanhoe was a Legislative Assembly electorate in the state of Western Australia. It covered part of the Goldfields city of Boulder, near Kalgoorlie, and neighbouring mining areas. It was created at the 1911 redistribution out of the former seats of Brown Hill and Ivanhoe, and was first contested at the 1911 election. It was abolished in the 1948 redistribution, with its area split between the neighbouring electorates of Boulder and Hannans, taking effect from the 1950 election. The seat was a very safe one for the Labor Party.
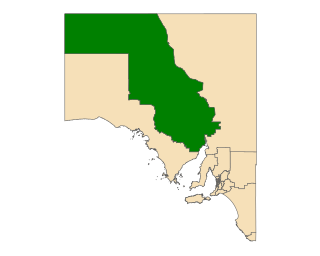
Giles is a single-member electoral district for the South Australian House of Assembly. Named after explorer Ernest Giles, it is the largest electorate in the state by area, covering 497,005 km2 (191,895 sq mi) of South Australian outback. Its main population centre is the industrial city of Whyalla on the far south-east border of the seat which represents half of the electorate's voters. The electorate covers significant areas of pastoral leases and Pitjantjatjara Aboriginal land stretching to the Western Australian and Northern Territory borders, taking in the remote towns of Andamooka, Coober Pedy, Ernabella, Fregon, Marla, Mimili, Mintabie, Oodnadatta, and Tarcoola. Giles also has a far north mobile booth.
Boulder was an electoral district of the Legislative Assembly in the Australian state of Western Australia from 1901 to 1977.
Hannans was an electoral district of the Legislative Assembly in the Australian state of Western Australia from 1901 to 1956.
This is a list of electoral results for the electoral district of Fremantle in Western Australian state elections.
This is a list of electoral results for the electoral district of Collie-Preston in Western Australian state elections.
This is a list of electoral results for the electoral district of Geraldton in Western Australian state elections.
This is a list of electoral results for the Electoral district of Dale in Western Australian state elections.
A by-election for the seat of Boulder in the Legislative Assembly of Western Australia was held on 4 December 1948. It was triggered by the death of Philip Collier, a former premier, on 18 October 1948. The Labor Party retained the seat at the election, with Charlie Oliver winning 78.9 percent of the first-preference vote.
This is a list of electoral results for the Electoral district of Beeloo in Western Australian state elections.
The 2021 Western Australian state election was held on Saturday, March 13, to elect members to the Parliament of Western Australia, where all 59 seats in the Legislative Assembly and all 36 seats in the Legislative Council were up for election.
This is a list of electoral results for the Electoral district of Mount Hawthorn in Western Australian state elections.
This is a list of electoral results for the Electoral district of Toodyay in Western Australian state elections.
This is a list of electoral results for the Electoral district of Wembley Beaches in Western Australian state elections.
This is a list of electoral results for the Electoral district of Northam in Western Australian state elections.
This is a list of electoral results for the Electoral district of West Perth in Western Australian state elections.
The 2022 Australian federal election was held on 21 May 2022 to elect all 151 members of the Australian House of Representatives and 40 of 76 members of the Australian Senate. Of those, 15 MPs and 6 senators were elected to represent the state of Western Australia.
The number of seats won by each party in the Australian House of Representatives at the 2022 federal election were: Coalition 58, Labor 77, Australian Greens 4, Centre Alliance 1, Katter's Australian Party 1, and Independents 10.