This is a list of electoral results for the Electoral district of Greenough in Western Australian elections.
Member | Party | Term | |
---|---|---|---|
William Traylen | Opposition | 1890–1897 | |
Richard Pennefather | Independent Ministerial | 1897–1901 | |
Patrick Stone | Independent | 1901–1904 | |
John Nanson | Ministerial | 1904–1905 | |
Patrick Stone | Ministerial | 1905–1908 | |
John Nanson | Ministerial | 1908–1914 | |
John Cunningham | Country | 1914–1917 | |
Henry Maley | Country | 1917–1924 | |
Maurice Kennedy | Labor | 1924–1930 | |
William Patrick | Country | 1930–1943 | |
John Newton | Labor | 1943–1945 | |
David Brand | Liberal | 1945–1949 | |
Liberal Country League | 1949–1968 | ||
Liberal | 1968–1975 | ||
Reg Tubby | Liberal | 1975–1989 | |
Kevin Minson | Liberal | 1989–2001 | |
Jamie Edwards | Liberal | 2001–2005 | |
Grant Woodhams | National | 2005–2008 | |
Party | Candidate | Votes | % | ±% | |
---|---|---|---|---|---|
Liberal | Jamie Edwards | 4,400 | 38.7 | +2.9 | |
National | Grant Woodhams | 2,967 | 26.1 | +15.4 | |
Labor | John Hart | 2,599 | 22.9 | +3.5 | |
Greens | Tonya Jensen | 546 | 4.8 | +4.6 | |
One Nation | Pauline Anderson | 535 | 4.7 | -23.1 | |
Christian Democrats | Steve Fletcher | 309 | 2.7 | +2.7 | |
Total formal votes | 11,356 | 95.7 | -1.3 | ||
Informal votes | 515 | 4.3 | +1.3 | ||
Turnout | 11,871 | 88.5 | |||
Two-party-preferred result | |||||
National | Grant Woodhams | 7,717 | 68.6 | +7.9 | |
Labor | John Hart | 3,540 | 31.4 | -7.9 | |
Two-candidate-preferred result | |||||
National | Grant Woodhams | 5,742 | 51.3 | +51.3 | |
Liberal | Jamie Edwards | 5,460 | 48.7 | -11.9 | |
National gain from Liberal | Swing | N/A |
Party | Candidate | Votes | % | ±% | |
---|---|---|---|---|---|
Liberal | Jamie Edwards | 4,439 | 35.4 | -36.7 | |
One Nation | Pam McCagh | 3,455 | 27.5 | +27.5 | |
Labor | Michelle Bone | 2,589 | 20.6 | -7.3 | |
National | Kevin Altham | 1,279 | 10.2 | +10.2 | |
Independent | David Whitehead | 783 | 6.2 | +6.2 | |
Total formal votes | 12,545 | 96.9 | 0.0 | ||
Informal votes | 405 | 3.1 | 0.0 | ||
Turnout | 12,950 | 90.3 | |||
Two-party-preferred result | |||||
Liberal | Jamie Edwards | 7,322 | 59.4 | -12.7 | |
Labor | Michelle Bone | 5,008 | 40.6 | +12.7 | |
Two-candidate-preferred result | |||||
Liberal | Jamie Edwards | 7,367 | 59.3 | -12.8 | |
One Nation | Pam McCagh | 5,057 | 40.7 | +40.7 | |
Liberal hold | Swing | -12.8 | |||
Party | Candidate | Votes | % | ±% | |
---|---|---|---|---|---|
Liberal | Kevin Minson | 8,202 | 72.1 | +15.7 | |
Labor | Carl Reynolds | 3,172 | 27.9 | +2.7 | |
Total formal votes | 11,374 | 96.9 | +0.3 | ||
Informal votes | 367 | 3.1 | -0.3 | ||
Turnout | 11,741 | 90.1 | |||
Liberal hold | Swing | +0.4 | |||
Party | Candidate | Votes | % | ±% | |
---|---|---|---|---|---|
Liberal | Kevin Minson | 6,805 | 57.8 | +3.4 | |
Labor | John Beenham | 2,833 | 24.1 | -2.0 | |
National | Glenys McDonald | 2,126 | 18.1 | -1.5 | |
Total formal votes | 11,764 | 96.5 | +2.0 | ||
Informal votes | 421 | 3.5 | -2.0 | ||
Turnout | 12,185 | 94.5 | +2.9 | ||
Two-party-preferred result | |||||
Liberal | Kevin Minson | 8,582 | 72.9 | +1.6 | |
Labor | John Beenham | 3,182 | 27.1 | -1.6 | |
Liberal hold | Swing | +1.6 | |||
Party | Candidate | Votes | % | ±% | |
---|---|---|---|---|---|
Liberal | Kevin Minson | 5,416 | 54.4 | -19.4 | |
Labor | Frank O'Loughlin | 2,599 | 26.1 | +0.4 | |
National | John Hutchinson | 1,948 | 19.5 | +18.0 | |
Total formal votes | 9,963 | 94.5 | |||
Informal votes | 580 | 5.5 | |||
Turnout | 10,543 | 91.6 | |||
Two-party-preferred result | |||||
Liberal | Kevin Minson | 7,102 | 71.3 | -2.6 | |
Labor | Frank O'Loughlin | 2,861 | 28.7 | +2.6 | |
Liberal hold | Swing | -2.6 | |||
Party | Candidate | Votes | % | ±% | |
---|---|---|---|---|---|
Liberal | Reg Tubby | 6,714 | 73.6 | +2.8 | |
Labor | David Ridley | 2,410 | 26.4 | -2.8 | |
Total formal votes | 9,124 | 97.4 | +0.1 | ||
Informal votes | 244 | 2.6 | -0.1 | ||
Turnout | 9,368 | 91.5 | +1.6 | ||
Liberal hold | Swing | +2.8 | |||
Party | Candidate | Votes | % | ±% | |
---|---|---|---|---|---|
Liberal | Reg Tubby | 5,345 | 70.8 | ||
Labor | Timothy Gamage | 2,206 | 29.2 | ||
Total formal votes | 7,551 | 97.3 | |||
Informal votes | 207 | 2.7 | |||
Turnout | 7,758 | 89.9 | |||
Liberal hold | Swing | ||||
Party | Candidate | Votes | % | ±% | |
---|---|---|---|---|---|
Liberal | Reg Tubby | 4,429 | 54.6 | -10.0 | |
National Country | Gordon Garratt | 1,508 | 18.6 | +18.6 | |
Labor | Edward Clarkson | 1,321 | 16.3 | -2.3 | |
National | Michael Bell | 589 | 7.3 | +7.3 | |
Progress | William Thomson | 262 | 3.2 | -13.6 | |
Total formal votes | 8,109 | 96.9 | -0.7 | ||
Informal votes | 259 | 3.1 | +0.7 | ||
Turnout | 8,368 | 90.5 | -2.1 | ||
Two-party-preferred result | |||||
Liberal | Reg Tubby | 6,440 | 79.4 | +2.2 | |
Labor | Edward Clarkson | 1,669 | 20.6 | -2.2 | |
Liberal hold | Swing | +2.2 | |||
Party | Candidate | Votes | % | ±% | |
---|---|---|---|---|---|
Liberal | Reg Tubby | 4,965 | 64.6 | ||
Labor | Kenneth Davis | 1,432 | 18.6 | ||
Progress | Geoffrey McNeil | 1,293 | 16.8 | ||
Total formal votes | 7,690 | 97.6 | |||
Informal votes | 190 | 2.4 | |||
Turnout | 7,880 | 92.6 | |||
Two-party-preferred result | |||||
Liberal | Reg Tubby | 5,935 | 77.2 | -0.6 | |
Labor | Kenneth Davis | 1,755 | 22.8 | +0.6 | |
Liberal hold | Swing | -0.6 | |||
Party | Candidate | Votes | % | ±% | |
---|---|---|---|---|---|
Liberal | Reginald Tubby | 2,851 | 45.2 | –33.6 | |
National Country | Reginald Thompson | 1,715 | 27.2 | +27.2 | |
Labor | Frederick Newman | 860 | 13.6 | –7.6 | |
Workers | Geoffrey McNeil | 818 | 13.0 | +13.0 | |
Independent | James Croasdale | 68 | 1.1 | +1.1 | |
Total formal votes | 6,312 | 98.4 | +0.9 | ||
Informal votes | 192 | 1.6 | –0.9 | ||
Turnout | 6,414 | 86.2 | –3.3 | ||
Two-candidate-preferred result | |||||
Liberal | Reginald Tubby | 3,617 | 57.3 | N/A | |
National Country | Reginald Thompson | 2,695 | 42.7 | N/A | |
Liberal hold | Swing | N/A | |||
Party | Candidate | Votes | % | ±% | |
---|---|---|---|---|---|
Liberal | David Brand | 4,999 | 78.8 | ||
Labor | Frederic Newman | 1,343 | 21.2 | ||
Total formal votes | 6,342 | 97.3 | |||
Informal votes | 176 | 2.7 | |||
Turnout | 6,518 | 89.5 | |||
Liberal hold | Swing | ||||
Party | Candidate | Votes | % | ±% | |
---|---|---|---|---|---|
Liberal | David Brand | 3,321 | 52.6 | -47.4 | |
Labor | Fredric Newman | 1,687 | 26.7 | +26.7 | |
Independent | Leonard Hamersley | 753 | 11.9 | +11.9 | |
Democratic Labor | John Wade | 556 | 8.8 | +8.8 | |
Total formal votes | 6,317 | 96.1 | |||
Informal votes | 258 | 3.9 | |||
Turnout | 6,575 | 91.2 | |||
Two-party-preferred result | |||||
Liberal | David Brand | 4,321 | 68.4 | -31.6 | |
Labor | Fredric Newman | 1,996 | 31.6 | +31.6 | |
Liberal hold | Swing | N/A | |||
Party | Candidate | Votes | % | ±% | |
---|---|---|---|---|---|
Liberal and Country | David Brand | unopposed | |||
Liberal and Country hold | Swing | ||||
Party | Candidate | Votes | % | ±% | |
---|---|---|---|---|---|
Liberal and Country | David Brand | unopposed | |||
Liberal and Country hold | Swing | ||||
Party | Candidate | Votes | % | ±% | |
---|---|---|---|---|---|
Liberal and Country | David Brand | 4,188 | 95.4 | ||
Communist | John Gandini | 202 | 4.6 | ||
Total formal votes | 4,390 | 96.5 | |||
Informal votes | 160 | 3.5 | |||
Turnout | 4,550 | 90.1 | |||
Liberal and Country hold | Swing | ||||
Party | Candidate | Votes | % | ±% | |
---|---|---|---|---|---|
Liberal and Country | David Brand | unopposed | |||
Liberal and Country hold | Swing | ||||
Party | Candidate | Votes | % | ±% | |
---|---|---|---|---|---|
Liberal and Country | David Brand | unopposed | |||
Liberal and Country hold | Swing | ||||
Party | Candidate | Votes | % | ±% | |
---|---|---|---|---|---|
Liberal and Country | David Brand | 2,691 | 65.5 | -34.5 | |
Labor | James Clune | 1,414 | 34.5 | +34.5 | |
Total formal votes | 4,105 | 98.6 | |||
Informal votes | 60 | 1.4 | |||
Turnout | 4,165 | 91.4 | |||
Liberal and Country hold | Swing | ||||
Party | Candidate | Votes | % | ±% | |
---|---|---|---|---|---|
Liberal and Country | David Brand | unopposed | |||
Liberal and Country hold | Swing | ||||
Party | Candidate | Votes | % | ±% | |
---|---|---|---|---|---|
Liberal | David Brand | 2,601 | 66.9 | +66.9 | |
Labor | Thomas Shanahan | 1,286 | 33.1 | -19.7 | |
Total formal votes | 3,887 | 99.1 | +0.5 | ||
Informal votes | 34 | 0.9 | -0.5 | ||
Turnout | 3,921 | 82.6 | +1.7 | ||
Liberal gain from Labor | Swing | +19.7 |
Party | Candidate | Votes | % | ±% | |
---|---|---|---|---|---|
Labor | Edward Newton | 1,508 | 41.8 | -11.0 | |
Liberal | David Brand | 1,227 | 34.0 | +34.0 | |
Country | Francis Horwood | 869 | 24.1 | -23.1 | |
Total formal votes | 3,604 | 99.0 | +0.4 | ||
Informal votes | 37 | 1.0 | -0.4 | ||
Turnout | 3,641 | 76.9 | -4.0 | ||
Two-party-preferred result | |||||
Liberal | David Brand | 1,956 | 54.3 | +54.3 | |
Labor | Edward Newton | 1,648 | 45.7 | -7.1 | |
Liberal gain from Labor | Swing | N/A |
Party | Candidate | Votes | % | ±% | |
---|---|---|---|---|---|
Labor | John Newton | 1,944 | 52.8 | +52.8 | |
Country | William Patrick | 1,737 | 47.2 | -52.8 | |
Total formal votes | 3,681 | 98.6 | |||
Informal votes | 52 | 1.4 | |||
Turnout | 3,733 | 80.9 | |||
Labor gain from Country | Swing | N/A |
Party | Candidate | Votes | % | ±% | |
---|---|---|---|---|---|
Country | William Patrick | unopposed | |||
Country hold | Swing | ||||
Party | Candidate | Votes | % | ±% | |
---|---|---|---|---|---|
Country | William Patrick | 1,727 | 51.4 | +13.3 | |
Independent Labor | John Garland | 1,356 | 40.3 | +40.3 | |
Independent | Henry Carson | 279 | 8.3 | +8.3 | |
Total formal votes | 3,362 | 99.1 | +0.7 | ||
Informal votes | 32 | 0.9 | -0.7 | ||
Turnout | 3,394 | 61.7 | -21.8 | ||
Country hold | Swing | N/A | |||
Party | Candidate | Votes | % | ±% | |
---|---|---|---|---|---|
Labor | John Steele | 1,844 | 38.1 | 0.0 | |
Country | William Patrick | 1,428 | 29.5 | -5.1 | |
Country | Kenneth Jones | 965 | 19.9 | +19.9 | |
Independent Country | Paul McGuiness | 599 | 12.4 | +12.4 | |
Total formal votes | 4,836 | 98.4 | -0.6 | ||
Informal votes | 76 | 1.6 | +0.6 | ||
Turnout | 4,912 | 83.5 | +15.2 | ||
Two-party-preferred result | |||||
Country | William Patrick | 2,648 | 54.8 | -0.2 | |
Labor | John Steele | 2,188 | 45.2 | +0.2 | |
Country hold | Swing | -0.2 | |||
Party | Candidate | Votes | % | ±% | |
---|---|---|---|---|---|
Labor | Maurice Kennedy | 1,498 | 38.1 | ||
Country | William Patrick | 1,361 | 34.6 | ||
Independent | Henry Maley | 1,076 | 27.3 | ||
Total formal votes | 3,935 | 99.0 | |||
Informal votes | 40 | 1.0 | |||
Turnout | 3,975 | 68.3 | |||
Two-party-preferred result | |||||
Country | William Patrick | 2,164 | 55.0 | ||
Labor | Maurice Kennedy | 1,771 | 45.0 | ||
Country gain from Labor | Swing |
Party | Candidate | Votes | % | ±% | |
---|---|---|---|---|---|
Labor | Maurice Kennedy | 1,191 | 47.7 | +3.6 | |
Country | Charles Smith | 661 | 26.5 | +6.7 | |
Nationalist | Henry Maley | 646 | 25.9 | -10.2 | |
Total formal votes | 2,498 | 98.4 | -0.7 | ||
Informal votes | 40 | 1.6 | +0.7 | ||
Turnout | 2,538 | 80.9 | +13.8 | ||
Two-party-preferred result | |||||
Labor | Maurice Kennedy | 1,290 | 51.6 | +1.0 | |
Country | Charles Smith | 1,208 | 48.4 | -1.0 | |
Labor hold | Swing | +1.0 | |||
Party | Candidate | Votes | % | ±% | |
---|---|---|---|---|---|
Labor | Maurice Kennedy | 861 | 44.1 | +6.0 | |
Country | Henry Maley | 705 | 36.1 | -25.8 | |
Executive Country | William Patrick | 387 | 19.8 | +19.8 | |
Total formal votes | 1,953 | 99.1 | -0.3 | ||
Informal votes | 17 | 0.9 | +0.3 | ||
Turnout | 1,970 | 67.1 | -2.3 | ||
Two-party-preferred result | |||||
Labor | Maurice Kennedy | 989 | 50.6 | +12.5 | |
Country | Henry Maley | 964 | 49.4 | -12.5 | |
Labor gain from Country | Swing | +12.5 |
Party | Candidate | Votes | % | ±% | |
---|---|---|---|---|---|
Country | Henry Maley | 968 | 61.9 | +38.4 | |
Labor | Patrick Moy | 595 | 38.1 | +4.3 | |
Total formal votes | 1,563 | 99.4 | +2.6 | ||
Informal votes | 10 | 0.6 | -2.6 | ||
Turnout | 1,573 | 69.4 | +8.3 | ||
Country hold | Swing | +4.1 | |||
Party | Candidate | Votes | % | ±% | |
---|---|---|---|---|---|
Labor | Patrick Moy | 499 | 33.8 | +33.8 | |
National Country | John Cunningham | 390 | 26.4 | –50.6 | |
National Country | Henry Maley | 347 | 23.5 | +23.5 | |
Nationalist | Sydney Hosken | 242 | 16.4 | +16.4 | |
Total formal votes | 1,478 | 96.9 | –1.9 | ||
Informal votes | 48 | 3.1 | +1.9 | ||
Turnout | 1,526 | 61.1 | +24.2 | ||
Two-party-preferred result | |||||
National Country | Henry Maley | 854 | 57.8 | +57.8 | |
Labor | Patrick Moy | 624 | 42.2 | +42.2 | |
National Country hold | Swing | N/A | |||
Party | Candidate | Votes | % | ±% | |
---|---|---|---|---|---|
Country | John Cunningham | 986 | 77.0 | +77.0 | |
Liberal | Ernest Udy | 294 | 23.0 | -28.0 | |
Total formal votes | 1,280 | 98.8 | -0.6 | ||
Informal votes | 16 | 1.2 | +0.6 | ||
Turnout | 1,296 | 36.9 | -33.6 | ||
Country gain from Liberal | Swing | N/A |
Party | Candidate | Votes | % | ±% | |
---|---|---|---|---|---|
Ministerial | John Nanson | 721 | 51.0 | ||
Labor | Sydney Hosken | 693 | 49.0 | ||
Total formal votes | 1,414 | 99.4 | |||
Informal votes | 9 | 0.6 | |||
Turnout | 1,423 | 70.5 | |||
Ministerial hold | Swing | ||||
Party | Candidate | Votes | % | ±% | |
---|---|---|---|---|---|
Ministerial | John Nanson | 567 | 62.4 | +62.4 | |
Ministerial | Patrick Stone | 342 | 37.6 | -7.4 | |
Total formal votes | 909 | 98.4 | -0.2 | ||
Informal votes | 15 | 1.6 | +0.2 | ||
Turnout | 924 | 58.4 | +2.9 | ||
Ministerial hold | Swing | N/A | |||
Party | Candidate | Votes | % | ±% | |
---|---|---|---|---|---|
Independent National | Patrick Stone | 314 | 45.0 | +14.4 | |
Ministerial | Edward Harney | 235 | 33.7 | +33.7 | |
Ministerial | Henry Maley | 149 | 21.4 | +21.4 | |
Total formal votes | 698 | 98.6 | +0.4 | ||
Informal votes | 10 | 1.4 | –0.4 | ||
Turnout | 708 | 55.5 | –6.7 | ||
Independent National gain from Ministerial | Swing | +14.4 |
Party | Candidate | Votes | % | ±% | |
---|---|---|---|---|---|
Ministerial | John Nanson | 289 | 35.0 | +35.0 | |
Independent | Patrick Stone | 211 | 25.6 | –9.9 | |
Independent | Samuel Mitchell | 181 | 21.9 | +21.9 | |
Independent | Richard Pennefather | 144 | 17.5 | +17.5 | |
Total formal votes | 825 | 98.2 | +0.1 | ||
Informal votes | 15 | 1.8 | –0.1 | ||
Turnout | 839 | 62.2 | –5.0 | ||
Ministerial hold | Swing | N/A | |||
Party | Candidate | Votes | % | ±% | |
---|---|---|---|---|---|
Ministerial | Patrick Stone | 113 | 35.5 | +35.5 | |
Ministerial | John Morrell | 102 | 32.1 | +32.1 | |
Ministerial | Joseph Dreyer | 80 | 25.2 | +25.2 | |
Opposition | Charles Cheeseborough | 23 | 7.2 | +7.2 | |
Total formal votes | 318 | 98.1 | +0.2 | ||
Informal votes | 6 | 1.9 | –0.2 | ||
Turnout | 324 | 67.2 | –11.1 | ||
Ministerial hold | Swing | N/A | |||
Party | Candidate | Votes | % | ±% | |
---|---|---|---|---|---|
Independent National | Richard Pennefather | 73 | 52.9 | ||
Ministerial | William Traylen | 41 | 29.7 | ||
Ministerial | Major Logue | 24 | 17.4 | ||
Total formal votes | 138 | 97.9 | |||
Informal votes | 3 | 2.1 | |||
Turnout | 141 | 78.3 | |||
Independent National gain from Ministerial | Swing |
Party | Candidate | Votes | % | ±% | |
---|---|---|---|---|---|
None | William Traylen | 56 | 50.5 | –49.5 | |
None | Major Logue | 55 | 49.5 | +49.5 |
Party | Candidate | Votes | % | ±% | |
---|---|---|---|---|---|
None | William Traylen | unopposed |
Geraldton is an electoral district of the Legislative Assembly in the Australian state of Western Australia.
Greenough was an electoral district of the Legislative Assembly in the Australian state of Western Australia from 1890 to 2008.
Moore is an electoral district of the Legislative Assembly in the Australian state of Western Australia.
The City of Geraldton was a local government area in the Mid West region of Western Australia, 424 kilometres (263 mi) north of the state capital, Perth on the Indian Ocean. The City covered an area of 46.3 square kilometres (17.9 sq mi), and its seat of government was the town of Geraldton.
The Shire of Greenough was a local government area in the Mid West region of Western Australia, 420 kilometres (261 mi) north of the state capital, Perth surrounding the city of Geraldton. The Shire covered an area of 1,752 square kilometres (676.5 sq mi), and its seat of government was the outer Geraldton suburb of Utakarra.
The City of Geraldton-Greenough was a local government area in the Mid West region of Western Australia, 424 kilometres (263 mi) north of the state capital, Perth on the Indian Ocean. It covered an area of 1,798.3 square kilometres (694.3 sq mi), and its seat of government was the town of Geraldton.
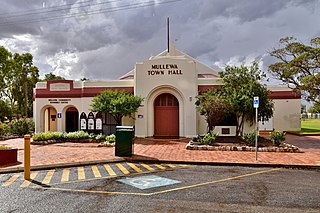
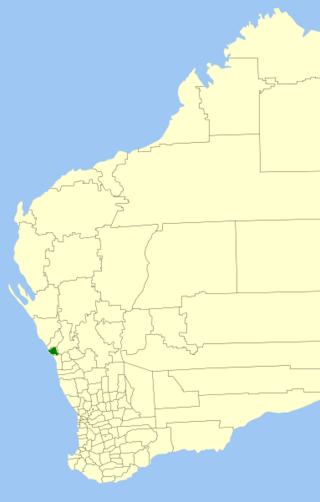
The Progress Party, initially known as the Workers Party, was a minor political party in Australia in the mid-to-late 1970s. It was formed on 26 January 1975, as a free-market right-libertarian and anti-socialist party, by businessmen John Singleton and Sinclair Hill, in reaction to the economic policies of Labor prime minister Gough Whitlam. It operated and ran candidates in Western Australia, the Northern Territory, South Australia, Queensland and New South Wales, but it did not have a central federal structure. Its Western Australian affiliate, which advocated secession from the rest of Australia, did particularly well in the area surrounding Geraldton in the state's Mid West. However, the party failed to win seats at any level of government and had gone out of existence by 1981.
This is a list of members of the Western Australian Legislative Assembly between the 1908 elections and the 1911 elections, together known as the Seventh Parliament.
The following is a list of members of the Western Australian Legislative Assembly between the 1897 elections and the 1901 elections, together known as the Third Parliament.
This is a list of members of the Western Australian Legislative Council from June 1872 to September 1874. The chamber had 18 members, as specified by the Legislative Council Act 1870. Section 1 of this Act specified that a minimum of one-third of the Council would be appointed by the Crown. Three of these were official nominees who were part of the Continuous Ministry—namely the Colonial Secretary, Attorney-General and the Surveyor-General—while the remaining three were "non-official nominees". All other positions were elected.
The City of Greater Geraldton is a local government area in the Mid West region of Western Australia, 424 kilometres (263 mi) north of the state capital, Perth on the Indian Ocean. It covers an area of 12,625.5 square kilometres (4,874.7 sq mi), and its seat of government is the town of Geraldton.
This is a list of electoral district results of the 1947 Western Australian election.
John Leighton Nanson was a journalist and politician in Western Australia. A former writer and sub-editor with The West Australian, he served in the Legislative Assembly of Western Australia from 1901 to 1905 and again from 1908 to 1914. Nanson was a minister in the governments of Alf Morgans, Walter James, Newton Moore, and Frank Wilson, including as attorney-general from 1909 to 1911.
Reginald John Tubby was an Australian politician who was a Liberal Party member of the Legislative Assembly of Western Australia from 1975 to 1989, representing the seat of Greenough.
William Patrick was an Australian politician who was a Country Party member of the Legislative Assembly of Western Australia from 1930 to 1943, representing the seat of Greenough. He was deputy leader of the Country Party from 1936 to 1943.
Henry Kennedy Maley was an Australian politician who was a Country Party member of the Legislative Assembly of Western Australia from 1917 to 1924 and again from 1929 to 1930. He was the state leader of the Country Party from 1922 to 1923, and a minister in the government of Sir James Mitchell from 1921 to 1924.
Elections were held in the Colony of Western Australia in December 1890 to elect 30 members to the Legislative Assembly. They were the first elections to be held for the Legislative Assembly, which had been created earlier in the year by a new constitution that granted Western Australia responsible self-government.
A by-election for the seat of Greenough in the Legislative Assembly of Western Australia was held on 1 November 1975. It was triggered by the resignation of Sir David Brand on 21 August 1975. The Liberal Party retained Greenough at the by-election, with its candidate, Reg Tubby, winning 57.3 percent of the two-candidate-preferred (2CP) vote. However, the party suffered a swing of 33.6 points on first preferences, in part due to the entry of two parties that had not stood in Greenough at the 1974 state election. The Workers Party was in fact making its electoral debut, and surprised most observers by polling 13 percent on first preferences.
This is a list of electoral district results of the 1986 Western Australian election.
The Great Australian Party is a political party in Australia. The party was formally registered by the Australian Electoral Commission (AEC) on 7 April 2019 and is associated with former senator Rod Culleton who had been elected in the 2016 Australian federal election as a senator for Western Australia, but subsequently found to have been ineligible and was disqualified.