| This article is part of a series on |
| Income in the United States of America |
|---|
 |
The followings lists are sorting Metropolitan statistical areas in the United States by per capita income.
| This article is part of a series on |
| Income in the United States of America |
|---|
| |
The followings lists are sorting Metropolitan statistical areas in the United States by per capita income.
Larger US metro areas by historical development of per capita personal income in current US Dollar.
| Metropolitan statistical area | 2022 | 2020 | 2010 | 2000 | 1990 | 1980 | 1970 |
|---|---|---|---|---|---|---|---|
| San Jose-Sunnyvale-Santa Clara, CA [1] | 141,516 | 122,544 | 60,111 | 53,212 | 25,446 | 13,272 | 5,079 |
| Bridgeport-Stamford-Norwalk, CT [2] | 125,185 | 115,859 | 102,572 | 61,662 | 33,700 | 14,988 | 6,130 |
| San Francisco-Oakland-Hayward, CA [3] | 123,736 | 107,815 | 60,501 | 49,049 | 26,623 | 13,972 | 5,713 |
| Boston-Cambridge-Newton, MA-NH [4] | 94,082 | 84,684 | 57,744 | 42,332 | 24,714 | 11,135 | 4,770 |
| Seattle-Tacoma-Bellevue, WA [5] | 92,113 | 81,785 | 48,456 | 38,641 | 22,825 | 12,270 | 4,758 |
| Denver-Aurora-Lakewood, CO [6] | 84,788 | 71,515 | 42,948 | 37,919 | 21,972 | 12,219 | 4,758 |
| New York-Newark-Jersey City, NY-NJ-PA [7] | 84,084 | 76,868 | 54,062 | 40,800 | 26,616 | 12,021 | 5,290 |
| Washington-Arlington-Alexandria, DC-VA-MD-WV [8] | 83,010 | 75,141 | 58,370 | 42,368 | 26,941 | 13,709 | 5,806 |
| Miami-Fort Lauderdale-West Palm Beach, FL [9] | 77,732 | 64,949 | 43,094 | 32,290 | 22,175 | 11,463 | 4,755 |
| Los Angeles-Long Beach-Anaheim, CA [10] | 76,445 | 69,362 | 44,169 | 31,776 | 22,236 | 12,199 | 5,062 |
| Minneapolis-St. Paul-Bloomington, MN-WI [11] | 75,164 | 66,431 | 46,226 | 36,987 | 22,589 | 11,680 | 4,711 |
| Austin-Round Rock, TX [12] | 75,119 | 64,453 | 41,042 | 33,077 | 18,243 | 9,632 | 3,672 |
| San Diego-Carlsbad, CA [13] | 74,326 | 67,536 | 43,889 | 33,680 | 21,000 | 11,562 | 5,140 |
| Nashville-Davidson-Murfreesboro-Franklin, TN [14] | 74,035 | 63,891 | 42,071 | 31,918 | 18,586 | 9,088 | 3,629 |
| Chicago-Naperville-Elgin, IL-IN-WI [15] | 72,512 | 65,862 | 44,319 | 35,946 | 22,627 | 11,698 | 4,945 |
| Baltimore-Columbia-Towson, MD [16] | 71,420 | 65,676 | 48,203 | 34,530 | 22,024 | 11,181 | 4,497 |
| Raleigh, NC [17] | 70,628 | 61,360 | 43,418 | 34,180 | 21,088 | 9,629 | 3,750 |
| Dallas-Fort Worth-Arlington, TX [18] | 70,493 | 61,681 | 41,657 | 33,798 | 20,663 | 11,355 | 4,335 |
| Hartford-West Hartford-East Hartford, CT | 69,787 | 66,219 | 50,090 | 37,897 | 25,164 | 11,932 | 4,983 |
| St. Louis, MO-IL [19] | 69,698 | 61,190 | 42,571 | 31,865 | 20,586 | 10,514 | 4,365 |
| Portland-Vancouver-Hillsboro, OR-WA [20] | 69,435 | 62,550 | 39,646 | 32,268 | 20,238 | 11,225 | 4,460 |
| Indianapolis-Carmel-Anderson, IN [21] | 68,719 | 60,412 | 41,593 | 32,729 | 20,130 | 10,282 | 4,164 |
| Omaha-Council Bluffs, NE-IA [22] | 68,586 | 59,897 | 45,186 | 32,757 | 19,918 | 10,442 | 4,275 |
| Houston-The Woodlands-Sugar Land, TX [23] | 68,344 | 59,674 | 45,627 | 33,254 | 20,076 | 12,087 | 4,240 |
| Richmond, VA [24] | 68,205 | 61,305 | 42,736 | 32,317 | 21,736 | 10,706 | 4,039 |
| Milwaukee-Waukesha-West Allis, WI [25] | 68,155 | 60,530 | 43,647 | 33,610 | 20,917 | 11,360 | 4,570 |
| Sacramento-Roseville-Arden-Arcade, CA [26] | 66,940 | 61,712 | 40,802 | 31,403 | 20,391 | 11,230 | 4,761 |
| Pittsburgh, PA [27] | 65,792 | 61,414 | 42,763 | 30,695 | 19,481 | 10,430 | 4,091 |
| Cincinnati, OH-KY-IN [28] | 65,253 | 58,803 | 39,883 | 30,893 | 19,556 | 9,973 | 4,095 |
| Charlotte-Concord-Gastonia, NC-SC [29] | 65,156 | 58,149 | 38,793 | 30,476 | 18,920 | 8,292 | 3,585 |
| Salt Lake City, UT [30] | 65,085 | 56,393 | 35,696 | 27,500 | 16,467 | 9,243 | 3,908 |
| Urban Honolulu, HI [31] | 64,936 | 60,273 | 44,945 | 31,260 | 23,895 | 12,340 | 5,828 |
| Atlanta-Sandy Springs-Roswell, GA [32] | 64,107 | 58,140 | 38,666 | 33,861 | 20,624 | 10,102 | 4,133 |
| Providence-Warwick, RI-MA [33] | 63,746 | 59,500 | 41,924 | 29,798 | 19,696 | 9,691 | 4,165 |
| Kansas City, MO-KS [34] | 63,417 | 57,427 | 41,371 | 32,030 | 19,895 | 10,814 | 4,346 |
| Cleveland-Elyria, OH [35] | 62,921 | 56,884 | 39,702 | 31,748 | 21,524 | 11,195 | 4,631 |
| Birmingham-Hoover, AL [36] | 62,262 | 54,817 | 39,422 | 29,499 | 18,233 | 9,125 | 3,468 |
| Phoenix-Mesa-Scottsdale, AZ [37] | 61,840 | 54,747 | 35,092 | 28,901 | 18,878 | 10,484 | 4,225 |
| New Orleans-Metairie, LA [38] | 61,801 | 56,248 | 42,926 | 27,159 | 17,540 | 9,916 | 3,750 |
| Louisville/Jefferson County, KY-IN [39] | 61,490 | 54,631 | 37,825 | 30,253 | 18,907 | 9,529 | 3,972 |
| Detroit-Warren-Dearborn, MI [40] | 61,322 | 56,901 | 38,240 | 34,525 | 21,295 | 11,252 | 4,612 |
| Columbus, OH [41] | 61,228 | 55,902 | 38,682 | 30,863 | 19,241 | 9,765 | 4,061 |
| Oklahoma City, OK [42] | 60,687 | 53,642 | 39,411 | 26,601 | 17,504 | 10,949 | 4,144 |
| Tampa-St. Petersburg-Clearwater, FL [43] | 60,091 | 53,629 | 38,780 | 29,223 | 18,985 | 9,789 | 3,875 |
| Las Vegas-Henderson-Paradise, NV [44] | 59,150 | 52,562 | 35,707 | 31,007 | 19,957 | 11,422 | 5,176 |
| Virginia Beach-Norfolk-Newport News, VA-NC [45] | 57,873 | 52,283 | 40,417 | 28,001 | 18,748 | 10,169 | 4,172 |
| Memphis, TN-MS-AR [46] | 56,440 | 51,325 | 37,012 | 29,527 | 17,983 | 9,165 | 3,521 |
| Buffalo-Cheektowaga-Niagara Falls, NY [47] | 56,414 | 54,208 | 38,394 | 28,227 | 19,365 | 9,962 | 4,194 |
| San Antonio-New Braunfels, TX [48] | 55,180 | 50,165 | 36,557 | 26,954 | 16,458 | 9,169 | 3,847 |
| Orlando-Kissimmee-Sanford, FL [49] | 53,959 | 47,705 | 33,600 | 27,631 | 18,566 | 9,743 | 3,959 |
| Riverside-San Bernardino-Ontario, CA [50] | 50,407 | 47,177 | 30,231 | 23,508 | 17,930 | 10,285 | 4,294 |
| Population tables of U.S. cities |
|---|
 |
| Cities |
| Urban areas |
| Populous cities and metropolitan areas |
| Metropolitan areas |
| Megaregions |
|
Figures are from the 2010 United States census.
| Rank | Metropolitan statistical area | Population | Per capita income |
|---|---|---|---|
| 1 | Washington-Arlington-Alexandria, D.C-Virginia-Maryland MSA | 5,949,178 | $47,411 |
| 2 | San Jose-Santa Clara-Sunnyvale, California MSA | 1,918,944 | $40,392 |
| 3 | Seattle-Tacoma-Bellevue, Washington MSA | 3,611,644 | $39,322 |
| 4 | San Francisco-Oakland-Hayward, California MSA | 4,122,177 | $38,355 |
| 5 | Boston–Worcester–Lawrence, Massachusetts–New Hampshire–Maine–Connecticut CMSA | 5,819,100 | $37,311 |
| 6 | Honolulu, Hawaii MSA | 921,000 | $36,339 |
| 7 | Minneapolis-St. Paul-Bloomington, Minnesota MSA | 3,478,415 | $35,388 |
| 8 | Hartford, Connecticut MSA | 1,183,110 | $34,310 |
| 9 | Denver-Aurora-Lakewood, Colorado MSA | 2,871,068 | $32,399 |
| 10 | Portland-Vancouver-Hillsboro, Oregon MSA | 2,345,318 | $31,377 |
| 11 | Sarasota–Bradenton, Florida MSA | 589,959 | $30,344 |
| 12 | Anchorage, Alaska MSA | 260,283 | $30,129 |
| 13 | Baltimore-Towson, Maryland MSA | 2,700,000 | $29,771 |
| 14 | New York-Newark-White Plains, New York-New Jersey-Connecticut CMSA | 19,278,198 | $28,819 |
| 15 | Atlanta, Georgia MSA | 5,544,577 | $25,288 |
| 16 | Madison, Wisconsin MSA | 726,526 | $25,163 |
| 17 | Rochester, Minnesota MSA | 124,277 | $24,939 |
| 18 | Santa Fe, New Mexico MSA | 147,635 | $24,745 |
| 19 | Raleigh–Durham–Chapel Hill, North Carolina MSA | 1,187,941 | $24,698 |
| 20 | Fort Myers–Cape Coral, Florida MSA | 440,888 | $24,542 |
| 21 | Austin–San Marcos, Texas MSA | 2,271,214 | $24,516 |
| 22 | Salt Lake City-Addison-Blue Spring, Utah MSA | 1,333,666 | $24,277 |
| 23 | Cleveland-Elyria-Akron, Ohio MSA | 3,554,127 | $24,275 |
| 24 | Norwich–New London, Connecticut MSA | 293,566 | $24,225 |
| 25 | Portland, Maine MSA | 243,537 | $24,132 |
| 26 | Nashville-Davidson-Murfreesboro, Tennessee MSA | 1,789,712 | $23,994 |
| 27 | Fort Collins–Loveland, Colorado MSA | 251,494 | $23,689 |
| 28 | Richmond–Petersburg, Virginia MSA | 996,512 | $23,685 |
| 29 | Dallas–Fort Worth, Texas CMSA | 8,500,000 | $23,616 |
| 30 | Charlottesville, Virginia MSA | 159,576 | $23,533 |
| 31 | Charlotte–Gastonia–Rock Hill, North Carolina–South Carolina MSA | 2,335,440 | $23,417 |
| 32 | Kansas City, Missouri–Kansas MSA | 2,053,167 | $23,326 |
| 33 | Des Moines, Iowa MSA | 456,022 | $23,316 |
| 34 | Indianapolis, Indiana MSA | 1,999,935 | $23,198 |
| 35 | Springfield, Illinois MSA | 201,437 | $23,074 |
| 36 | Fort Pierce–Port St. Lucie, Florida MSA | 319,426 | $23,072 |
| 37 | Santa Barbara–Santa Maria–Lompoc, California MSA | 399,347 | $23,059 |
| 38 | Columbus, Ohio MSA | 1,987,911 | $23,020 |
| 39 | Milwaukee–Racine, Wisconsin CMSA | 2,240,231 | $23,003 |
| 40 | Cedar Rapids, Iowa MSA | 191,701 | $22,977 |
| 41 | Cincinnati–Hamilton, Ohio–Kentucky–Indiana CMSA | 2,435,418 | $22,947 |
| 42 | San Diego, California MSA | 3,926,941 | $22,926 |
| 43 | Philadelphia-Camden-Atlantic City, Pennsylvania-Delaware-New Jersey MSA | 6,138,144 | $22,874 |
| 44 | Burlington, Vermont MSA | 169,391 | $22,732 |
| 45 | St. Louis, Missouri–Illinois MSA | 2,603,607 | $22,698 |
| 46 | Reno, Nevada MSA | 312,000 | $22,592 |
| 47 | Detroit-Flint-Ann Arbor, Michigan MSA | 5,270,909 | $22,319 |
| 48 | Albany–Schenectady–Troy, New York MSA | 875,583 | $22,303 |
| 49 | Sacramento–Yolo, California CMSA | 1,796,857 | $22,302 |
| 50 | Bloomington–Normal, Illinois MSA | 150,433 | $22,227 |
| 51 | Iowa City, Iowa MSA | 111,006 | $22,220 |
| 52 | Omaha, Nebraska–Iowa MSA | 716,998 | $22,145 |
| 53 | Wilmington, North Carolina MSA | 233,450 | $22,100 |
| 54 | Huntsville, Alabama MSA | 342,376 | $22,073 |
| 55 | Kokomo, Indiana MSA | 101,541 | $22,029 |
| 56 | Colorado Springs, Colorado MSA | 516,929 | $22,005 |
| 57 | Boulder-Greeley Colorado, MSA | 714,000 | $22,004 |
| 58 | Harrisburg–Lebanon–Carlisle, Pennsylvania MSA | 629,401 | $21,936 |
| 59 | Phoenix–Mesa, Arizona MSA | 3,251,876 | $21,907 |
| 60 | Corvallis, Oregon MSA | 78,153 | $21,868 |
| 61 | San Luis Obispo–Atascadero–Paso Robles, California MSA | 246,681 | $21,864 |
| 62 | Appleton–Oshkosh–Neenah, Wisconsin MSA | 358,365 | $21,837 |
| 63 | Punta Gorda, Florida MSA | 141,627 | $21,806 |
| 64 | Green Bay, Wisconsin MSA | 226,778 | $21,784 |
| 65 | Tampa–St. Petersburg–Clearwater, Florida MSA | 2,395,997 | $21,784 |
| 66 | Jacksonville, Florida MSA | 1,100,491 | $21,763 |
| 67 | Louisville, Kentucky–Indiana MSA | 1,025,598 | $21,756 |
| 68 | Houston–Galveston–Brazoria, Texas CMSA | 4,669,571 | $21,701 |
| 69 | Lansing–East Lansing, Michigan MSA | 447,728 | $21,653 |
| 70 | Binghamton, New York MSA | 1,098,201 | $21,627 |
| 71 | Dayton–Springfield, Ohio MSA | 950,558 | $21,598 |
| 72 | Sheboygan, Wisconsin MSA | 112,646 | $21,509 |
| 73 | Melbourne–Titusville–Palm Bay, Florida MSA | 476,230 | $21,484 |
| 74 | Birmingham, Alabama MSA | 921,106 | $21,410 |
| 75 | Peoria–Pekin, Illinois MSA | 347,387 | $21,402 |
| 76 | Greensboro–Winston-Salem–High Point, North Carolina MSA | 1,251,509 | $21,392 |
| 77 | Roanoke, Virginia MSA | 235,932 | $21,366 |
| 78 | Lincoln, Nebraska MSA | 250,291 | $21,265 |
| 79 | Pittsfield, Massachusetts MSA | 84,699 | $21,258 |
| 80 | Allentown–Bethlehem–Easton, Pennsylvania MSA | 637,958 | $21,243 |
| 81 | Lexington, Kentucky MSA | 479,198 | $21,237 |
| 82 | Orlando, Florida MSA | 1,644,561 | $21,232 |
| 83 | Reading, Pennsylvania MSA | 373,638 | $21,232 |
| 84 | Las Vegas, Nevada–Arizona MSA | 1,563,282 | $21,210 |
| 85 | Providence–Fall River–Warwick, Rhode Island MSA | 1,188,613 | $21,208 |
| 86 | Los Angeles–Riverside–Orange County, California CMSA | 16,373,645 | $21,170 |
| 87 | Rockford, Illinois MSA | 371,236 | $21,145 |
| 88 | York, Pennsylvania MSA | 381,751 | $21,086 |
| 89 | Sioux Falls, South Dakota MSA | 172,412 | $20,936 |
| 90 | Pittsburgh, Pennsylvania MSA | 2,358,695 | $20,935 |
| 91 | Fort Walton Beach, Florida MSA | 170,498 | $20,918 |
| 92 | Topeka, Kansas MSA | 169,871 | $20,904 |
| 93 | Columbia, South Carolina MSA | 536,691 | $20,902 |
| 94 | Grand Rapids–Muskegon–Holland, Michigan MSA | 1,088,514 | $20,901 |
| 95 | Janesville–Beloit, Wisconsin MSA | 152,307 | $20,895 |
| 96 | Savannah, Georgia MSA | 293,000 | $20,752 |
| 97 | Wausau, Wisconsin MSA | 125,834 | $20,703 |
| 98 | Fort Wayne, Indiana MSA | 502,141 | $20,701 |
| 99 | Wichita, Kansas MSA | 545,220 | $20,692 |
| 100 | Toledo, Ohio MSA | 618,203 | $20,565 |
| 101 | Knoxville, Tennessee MSA | 687,249 | $20,538 |
| 102 | Davenport–Moline–Rock Island, Iowa–Illinois MSA | 359,062 | $20,464 |
| 103 | Miami–Fort Lauderdale-West Palm Beach, Florida CMSA | 3,876,380 | $20,454 |
| 104 | Evansville–Henderson, Indiana–Kentucky MSA | 296,195 | $20,439 |
| 105 | Lancaster, Pennsylvania MSA | 470,658 | $20,398 |
| 106 | Charleston, West Virginia MSA | 251,662 | $20,378 |
| 107 | Norfolk–Virginia Beach–Newport News, Virginia–North Carolina MSA | 1,569,541 | $20,328 |
| 108 | Memphis, Tennessee–Arkansas–Mississippi MSA | 1,135,614 | $20,327 |
| 109 | Kalamazoo–Battle Creek, Michigan MSA | 452,851 | $20,324 |
| 110 | Saginaw–Bay City–Midland, Michigan MSA | 403,070 | $20,320 |
| 111 | Boise City, Idaho MSA | 432,345 | $20,280 |
| 112 | Little Rock–North Little Rock, Arkansas MSA | 724,294 | $20,263 |
| 113 | Elkhart–Goshen, Indiana MSA | 182,791 | $20,250 |
| 114 | Jackson, Michigan MSA | 158,422 | $20,171 |
| 115 | Salinas, California MSA | 401,762 | $20,165 |
| 116 | Canton–Massillon, Ohio MSA | 406,934 | $20,154 |
| 117 | Buffalo–Niagara Falls, New York MSA | 1,170,111 | $20,143 |
| 118 | Tulsa, Oklahoma MSA | 803,235 | $20,092 |
| 119 | Decatur, Illinois MSA | 114,706 | $20,067 |
| 120 | Albuquerque, New Mexico MSA | 712,738 | $20,025 |
| 121 | Bellingham, Washington MSA | 166,814 | $20,025 |
| 122 | Asheville, North Carolina MSA | 225,965 | $20,010 |
| 123 | Syracuse, New York MSA | 732,117 | $20,002 |
| 124 | Tallahassee, Florida MSA | 284,539 | $19,990 |
| 125 | Springfield, Massachusetts MSA | 591,932 | $19,976 |
| 126 | Benton Harbor, Michigan MSA | 162,453 | $19,952 |
| 127 | Lawrence, Kansas MSA | 99,962 | $19,952 |
| 128 | Myrtle Beach, South Carolina MSA | 196,629 | $19,949 |
| 129 | Chattanooga, Tennessee–Georgia MSA | 465,161 | $19,944 |
| 130 | Fargo–Moorhead, North Dakota–Minnesota MSA | 174,367 | $19,910 |
| 131 | Daytona Beach, Florida MSA | 493,175 | $19,888 |
| 132 | Columbia, Missouri MSA | 135,454 | $19,844 |
| 133 | Richland–Kennewick–Pasco, Washington MSA | 191,822 | $19,798 |
| 134 | Tucson, Arizona MSA | 843,746 | $19,785 |
| 135 | Ogden, Utah MSA | 211,277 | $19,781 |
| 136 | Charleston–North Charleston, South Carolina MSA | 549,033 | $19,772 |
| 137 | South Bend, Indiana MSA | 265,559 | $19,756 |
| 138 | Greenville–Spartanburg–Anderson, South Carolina MSA | 962,441 | $19,716 |
| 139 | Champaign–Urbana, Illinois MSA | 179,669 | $19,708 |
| 140 | Eugene–Springfield, Oregon MSA | 322,959 | $19,681 |
| 141 | La Crosse, Wisconsin–Minnesota MSA | 126,838 | $19,649 |
| 142 | Cheyenne, Wyoming MSA | 81,607 | $19,634 |
| 143 | Dubuque, Iowa MSA | 89,143 | $19,600 |
| 144 | Bismarck, North Dakota MSA | 94,719 | $19,572 |
| 145 | Medford–Ashland, Oregon MSA | 181,269 | $19,498 |
| 146 | Jackson, Mississippi MSA | 440,801 | $19,435 |
| 147 | Glens Falls, New York MSA | 124,345 | $19,368 |
| 148 | Oklahoma City, Oklahoma MSA | 1,083,346 | $19,366 |
| 149 | Billings, Montana MSA | 129,352 | $19,303 |
| 150 | Muncie, Indiana MSA | 118,769 | $19,233 |
| 151 | Spokane, Washington MSA | 417,939 | $19,233 |
| 152 | Bangor, Maine MSA | 90,864 | $19,194 |
| 153 | St. Cloud, Minnesota MSA | 167,392 | $19,170 |
| 154 | Lafayette, Indiana MSA | 182,821 | $19,095 |
| 155 | Tyler, Texas MSA | 174,706 | $19,072 |
| 156 | Rochester, New York MSA | 1,079,671 | $19,067 |
| 157 | Pensacola, Florida MSA | 412,153 | $19,054 |
| 158 | Tuscaloosa, Alabama MSA | 164,875 | $18,998 |
| 159 | Rapid City, South Dakota MSA | 88,565 | $18,938 |
| 160 | Casper, Wyoming MSA | 66,533 | $18,913 |
| 161 | Montgomery, Alabama MSA | 333,055 | $18,910 |
| 162 | Lynchburg, Virginia MSA | 214,911 | $18,887 |
| 163 | Waterloo–Cedar Falls, Iowa MSA | 128,012 | $18,885 |
| 164 | Eau Claire, Wisconsin MSA | 148,337 | $18,875 |
| 165 | Baton Rouge, Louisiana MSA | 602,894 | $18,867 |
| 166 | Jackson, Tennessee MSA | 107,377 | $18,863 |
| 167 | Sherman–Denison, Texas MSA | 110,595 | $18,862 |
| 168 | Lewiston–Auburn, Maine MSA | 90,830 | $18,848 |
| 169 | Macon, Georgia MSA | 322,549 | $18,840 |
| 170 | New Orleans, Louisiana MSA | 1,337,726 | $18,834 |
| 171 | Augusta–Aiken, Georgia–South Carolina MSA | 477,441 | $18,744 |
| 172 | Duluth–Superior, Minnesota–Wisconsin MSA | 243,815 | $18,743 |
| 173 | Owensboro, Kentucky MSA | 91,545 | $18,739 |
| 174 | Hickory–Morganton–Lenoir, North Carolina MSA | 341,851 | $18,723 |
| 175 | Grand Junction, Colorado MSA | 116,255 | $18,715 |
| 176 | Panama City, Florida MSA | 148,217 | $18,700 |
| 177 | Dover, Delaware MSA | 126,697 | $18,662 |
| 178 | Springfield, Missouri MSA | 325,721 | $18,611 |
| 179 | Decatur, Alabama MSA | 145,867 | $18,577 |
| 180 | Youngstown–Warren, Ohio MSA | 594,746 | $18,551 |
| 181 | Bloomington, Indiana MSA | 120,563 | $18,534 |
| 182 | San Antonio, Texas MSA | 1,592,383 | $18,518 |
| 183 | Gainesville, Florida MSA | 217,955 | $18,465 |
| 184 | Victoria, Texas MSA | 84,088 | $18,379 |
| 185 | Fayetteville–Springdale–Rogers, Arkansas MSA | 311,121 | $18,348 |
| 186 | Sioux City, Iowa–Nebraska MSA | 124,130 | $18,339 |
| 187 | Athens, Georgia MSA | 153,444 | $18,303 |
| 188 | Lakeland–Winter Haven, Florida MSA | 483,924 | $18,302 |
| 189 | Mansfield, Ohio MSA | 175,818 | $18,284 |
| 190 | Elmira, New York MSA | 91,070 | $18,264 |
| 191 | Amarillo, Texas MSA | 217,858 | $18,247 |
| 192 | Greenville, North Carolina MSA | 133,798 | $18,243 |
| 193 | Scranton–Wilkes-Barre–Hazleton, Pennsylvania MSA | 624,776 | $18,229 |
| 194 | Florence, Alabama MSA | 142,950 | $18,205 |
| 195 | Lima, Ohio MSA | 155,084 | $18,137 |
| 196 | Mobile, Alabama MSA | 540,258 | $18,126 |
| 197 | St. Joseph, Missouri MSA | 102,490 | $18,123 |
| 198 | Parkersburg–Marietta, West Virginia–Ohio MSA | 151,237 | $18,076 |
| 199 | State College, Pennsylvania MSA | 135,758 | $18,020 |
| 200 | Utica–Rome, New York MSA | 299,896 | $18,006 |
| 201 | Erie, Pennsylvania MSA | 280,843 | $17,932 |
| 202 | Biloxi–Gulfport–Pascagoula, Mississippi MSA | 363,988 | $17,899 |
| 203 | Florence, South Carolina MSA | 125,761 | $17,876 |
| 204 | Ocala, Florida MSA | 258,916 | $17,848 |
| 205 | Missoula, Montana MSA | 95,802 | $17,808 |
| 206 | Johnson City–Kingsport–Bristol, Tennessee–Virginia MSA | 480,091 | $17,800 |
| 207 | Dothan, Alabama MSA | 137,916 | $17,780 |
| 208 | Redding, California MSA | 163,256 | $17,738 |
| 209 | Lake Charles, Louisiana MSA | 183,577 | $17,710 |
| 210 | Grand Forks, North Dakota–Minnesota MSA | 97,478 | $17,679 |
| 211 | Odessa–Midland, Texas MSA | 237,132 | $17,642 |
| 212 | Sharon, Pennsylvania MSA | 120,293 | $17,636 |
| 213 | Shreveport–Bossier City, Louisiana MSA | 392,302 | $17,628 |
| 214 | Beaumont–Port Arthur, Texas MSA | 385,090 | $17,616 |
| 215 | Longview–Marshall, Texas MSA | 208,780 | $17,576 |
| 216 | Great Falls, Montana MSA | 80,357 | $17,566 |
| 217 | Columbus, Georgia–Alabama MSA | 274,624 | $17,559 |
| 218 | Chico–Paradise, California MSA | 203,171 | $17,517 |
| 219 | Terre Haute, Indiana MSA | 149,192 | $17,504 |
| 220 | Enid, Oklahoma MSA | 57,813 | $17,457 |
| 221 | Fayetteville, North Carolina MSA | 302,963 | $17,376 |
| 222 | Anniston, Alabama MSA | 112,249 | $17,367 |
| 223 | Stockton–Lodi, California MSA | 563,598 | $17,365 |
| 224 | San Angelo, Texas MSA | 104,010 | $17,325 |
| 225 | Lubbock, Texas MSA | 242,628 | $17,323 |
| 226 | Albany, Georgia MSA | 120,822 | $17,312 |
| 227 | Williamsport, Pennsylvania MSA | 120,044 | $17,224 |
| 228 | Abilene, Texas MSA | 126,555 | $17,176 |
| 229 | Waco, Texas MSA | 213,517 | $17,174 |
| 230 | Pueblo, Colorado MSA | 141,472 | $17,163 |
| 231 | Auburn–Opelika, Alabama MSA | 115,092 | $17,158 |
| 232 | Pocatello, Idaho MSA | 75,565 | $17,148 |
| 233 | Rocky Mount, North Carolina MSA | 143,026 | $17,142 |
| 234 | Wichita Falls, Texas MSA | 140,518 | $17,113 |
| 235 | Jonesboro, Arkansas MSA | 82,148 | $17,091 |
| 236 | Monroe, Louisiana MSA | 147,250 | $17,084 |
| 237 | Texarkana, Texas–Texarkana, Arkansas MSA | 129,749 | $17,072 |
| 238 | Danville, Virginia MSA | 110,156 | $17,061 |
| 239 | Flagstaff, Arizona–Utah MSA | 122,366 | $17,056 |
| 240 | Goldsboro, North Carolina MSA | 113,329 | $17,010 |
| 241 | Modesto, California MSA | 446,997 | $16,913 |
| 242 | Steubenville–Weirton, Ohio–West Virginia MSA | 132,008 | $16,911 |
| 243 | Jamestown, New York MSA | 139,750 | $16,840 |
| 244 | Gadsden, Alabama MSA | 103,459 | $16,783 |
| 245 | Corpus Christi, Texas MSA | 380,783 | $16,752 |
| 246 | Wheeling, West Virginia–Ohio MSA | 153,172 | $16,748 |
| 247 | Altoona, Pennsylvania MSA | 129,144 | $16,743 |
| 248 | Joplin, Missouri MSA | 157,322 | $16,653 |
| 249 | Fort Smith, Arkansas–Oklahoma MSA | 207,290 | $16,604 |
| 250 | Killeen–Temple, Texas MSA | 312,952 | $16,546 |
| 251 | Hattiesburg, Mississippi MSA | 111,674 | $16,450 |
| 252 | Cumberland, Maryland-West Virginia MSA | 102,008 | $16,409 |
| 253 | Huntington–Ashland, West Virginia–Kentucky–Ohio MSA | 315,538 | $16,357 |
| 254 | Clarksville–Hopkinsville, Tennessee–Kentucky MSA | 207,033 | $16,339 |
| 255 | Bryan–College Station, Texas MSA | 152,415 | $16,212 |
| 256 | Alexandria, Louisiana MSA | 126,337 | $16,088 |
| 257 | Lafayette, Louisiana MSA | 385,647 | $16,072 |
| 258 | Yuba City, California MSA | 139,149 | $15,998 |
| 259 | Houma, Louisiana MSA | 194,477 | $15,939 |
| 260 | Bakersfield, California MSA | 661,645 | $15,760 |
| 261 | Johnstown, Pennsylvania MSA | 232,621 | $15,755 |
| 262 | Lawton, Oklahoma MSA | 114,996 | $15,728 |
| 263 | Sumter, South Carolina MSA | 104,646 | $15,657 |
| 264 | Yakima, Washington MSA | 222,581 | $15,606 |
| 265 | Provo–Orem, Utah MSA | 368,536 | $15,557 |
| 266 | Pine Bluff, Arkansas MSA | 84,278 | $15,417 |
| 267 | Fresno, California MSA | 922,516 | $15,386 |
| 268 | Jacksonville, North Carolina MSA | 150,355 | $14,853 |
| 269 | Yuma, Arizona MSA | 160,026 | $14,802 |
| 270 | Merced, California MSA | 210,554 | $14,257 |
| 271 | Visalia–Tulare–Porterville, California MSA | 368,021 | $14,006 |
| 272 | Las Cruces, New Mexico MSA | 174,682 | $13,999 |
| 273 | El Paso, Texas MSA | 679,622 | $13,421 |
| 274 | Brownsville–Harlingen–San Benito, Texas MSA | 335,227 | $10,960 |
| 275 | Laredo, Texas MSA | 193,117 | $10,759 |
| 276 | McAllen–Edinburg–Mission, Texas MSA | 569,463 | $9,899 |
| 277 | San Juan–Caguas–Arecibo, Puerto Rico CMSA | 2,450,292 | $9,140 |
| 278 | Mayagüez, Puerto Rico MSA | 253,347 | $7,730 |
| 279 | Ponce, Puerto Rico MSA | 361,094 | $6,530 |
| 280 | Aguadilla, Puerto Rico MSA | 146,424 | $6,378 |

Hampton County is a rural county located in the U.S. state of South Carolina. As of the 2020 census, the population was 18,561. Its county seat is Hampton. It was named for Confederate Civil War general Wade Hampton, who in the late 1870s, with the ending of Reconstruction, was elected as governor of South Carolina.

Chester County is a county located in the U.S. state of South Carolina. As of the 2020 census, its population was 32,294. Its county seat is Chester.

The Kingsport–Bristol–Bristol metropolitan area is a metropolitan statistical area (MSA) in Northeast Tennessee and Southwest Virginia, United States, as defined by the Office of Management and Budget (OMB). It was formed in December 2003 by the merger of the Bristol, VA MSA and Kingsport–Bristol, TN–VA MSA.

The Pensacola metropolitan area is the metropolitan area centered on Pensacola, Florida. It is also known as the Pensacola–Ferry Pass–Brent Metropolitan Statistical Area, a metropolitan statistical area (MSA) used for statistical purposes by the United States Census Bureau and other agencies. The Pensacola Standard Metropolitan Statistical Area was first defined in 1958, with Pensacola as the principal city, and included Escambia and Santa Rosa counties. The MSA was renamed Pensacola–Ferry Pass–Brent MSA in 2003, with the unincorporated census-designated places Ferry Pass and Brent added as principal cities. The population of the MSA in the 2020 census was 511,502.

The Tallahassee metropolitan area is the metropolitan area centered on Tallahassee, the capital of the U.S. state of Florida, in Leon County. It is located in the center of North Florida in the Florida panhandle.
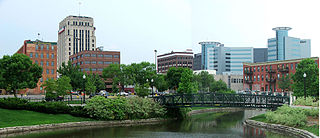
The Kalamazoo–Portage Metropolitan Area comprises a region surrounding Kalamazoo. 2015 estimates placed it as the 151st largest among similarly designated areas in the United States. 2015 estimates place the combined statistical area 85th among similarly designated areas.

The Corpus Christi metropolitan statistical area is a metropolitan area in South Texas that covers three counties–Aransas, Nueces, and San Patricio. As of the 2000 census, the MSA had a population of 413,280.
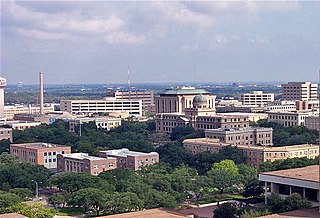
Bryan–College Station is a metropolitan area centering on the twin cities of Bryan and College Station, Texas, in the Brazos Valley region of Texas. The 2010 census placed the population of the three-county metropolitan area at 255,519. The 2019 population estimate was 273,101.

The Amarillo metropolitan statistical area is a metropolitan area in the Texas Panhandle that covers five counties: Armstrong, Carson, Potter, Randall, and Oldham. As of the 2020 census, the MSA had a population of 268,691.

The Lubbock metropolitan area is a metropolitan statistical area (MSA) in the South Plains region of West Texas, United States, that covers three counties – Crosby, Lubbock, and Lynn. As of the 2010 census, the Lubbock MSA had a population of 290,805, though a 2019 estimate placed the population at 322,257, which ranks it the 157th-most populated MSA in the United States. It is also part of the larger Lubbock–Plainview combined statistical area.

The Longview metropolitan statistical area is a metropolitan area in Northeast Texas that covers four counties—Gregg, Harrison, Rusk, and Upshur. As of the 2010 census the MSA had a population of 280,000. Before 2023, it was also part of the larger Longview–Marshall combined statistical area. In 2023, the Marshall micropolitan area was disestablished and its sole county, Harrison County, was made part of the Longview metropolitan area.

The Asheville metropolitan area is a metropolitan area centered on the principal city of Asheville, North Carolina. The U.S. Office of Management and Budget defines the Asheville, NC Metropolitan Statistical Area, a metropolitan statistical area used by the United States Census Bureau and other entities, as comprising the four counties of Buncombe, Haywood, Henderson, and Madison. The area's population was 424,858 according to the 2010 census, and 469,454 according to the 2020 census.

The Fayetteville, NC Metropolitan Statistical Area, as defined by the US Office of Management and Budget (OMB), is an area consisting of three counties – Cumberland, Harnett, and Hoke – in eastern North Carolina, anchored by the city of Fayetteville. It is served by Interstate 95, Interstate 295, U.S. and state highways, Fayetteville Regional Airport, Amtrak, Greyhound, Megabus and several railroad systems. As of the 2000 census, the MSA had a population of 336,609. As of the 2010 census the MSA had a population of 366,383. In 2011 the estimated population was 374,157. The 2019 estimated population is 526,719.

The Tuscaloosa metropolitan area, as defined by the United States Census Bureau, is an area consisting of four counties in west central Alabama, anchored by the city of Tuscaloosa. As of the 2020 census, the MSA had a population of 268,674.

The Cedar Rapids Metropolitan Statistical Area, as defined by the United States Census Bureau, is an area consisting of three counties in Iowa, anchored by the city of Cedar Rapids. As of the 2020 census, the MSA had a population of 276,520.

The Columbus metropolitan area, officially the Columbus metropolitan statistical area, and colloquially known as the Chattahoochee Valley, is a metropolitan statistical area consisting of six counties in the U.S. state of Georgia and one county in Alabama, anchored by the city of Columbus.

The Green Bay metropolitan statistical area, as defined by the United States Census Bureau, is a metropolitan area in northeastern Wisconsin anchored by the City of Green Bay. It is Wisconsin's fourth largest metropolitan statistical area by population. As of the 2020 Census, the MSA had a combined population of 328,268.

The Macon metropolitan area is a metropolitan statistical area consisting of five counties in Central Georgia, anchored by the principal city of Macon. At the 2010 U.S. census, the five-county area had a population of 232,293. A July 2017 estimate placed the population at 228,914. In 2022, its estimated population was 235,805.

The Northern California megaregion, distinct from Northern California, is an urbanized region of California consisting of many large cities including San Jose, San Francisco, Sacramento, and Oakland. There are varying definitions of the megaregion, but it is generally seen as encompassing the San Francisco Bay Area, the Sacramento area, northern San Joaquin Valley, and the Monterey Bay Area.