| This article is part of a series on |
| Income in the United States of America |
|---|
 |
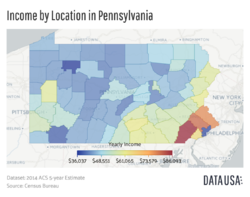
Pennsylvania has the 19th-highest per capita income in the nation at $35,804 annually and the 21st-highest median household income at $68,957 as of 2021.
| This article is part of a series on |
| Income in the United States of America |
|---|
| |
Pennsylvania has the 19th-highest per capita income in the nation at $35,804 annually and the 21st-highest median household income at $68,957 as of 2021.
The wealthiest regions of Pennsylvania are the suburban counties bordering Philadelphia, the state's most populous city. As of 2020, the wealthiest county in Pennsylvania is Chester County with a $104,161 median household income followed by Montgomery County ($93,518) and Bucks County ($93,181).
While there are wealthy locations in the suburbs of other cities, they tend to be more condensend into small locations.
One area known for its historic wealth is the Philadelphia Main Line, which includes Lower Merion, Radnor, Tredyffrin, Easttown, and Willistown townships. Some of Pennsylvania's most affluent neighborhoods and priciest real estate are located in communities located in these townships, including Ardmore, Bala Cynwyd, Gladwyne, Haverford, and Villanova. Chestnut Hill is another wealthy area, however no census data exists for it (except for zip code data), because it is part of Philadelphia. The Northeast wealth corridor also runs through Montgomery County, highest in the area of Whitpain, Lower Gwynedd, Plymouth, Upper Dublin and Whitemarsh townships; and into areas of Bucks County especially the area around New Hope, such as Solebury, Lower Makefield, and Upper Makefield townships.
Outside of the Philadelphia, Pittsburgh, and Harrisburg metropolitan areas, Pennsylvania is a relatively poorer state, especially in the northern areas and the Appalachian Mountains; only 22% of Pennsylvania places have per capita incomes higher than the national per capita income, and 11.0% of the population lives below the poverty line.
Among Pennsylvania households, 1.9% have annual incomes exceeding $200,000 annually, and 10.3% have incomes of $100,000 or more annually. In the state, 9.7% have incomes less than $10,000, and 43.8% have incomes less than $34,999.
Note: Data is from the 2010 United States Census Data and the 2006-2010 American Community Survey 5-Year Estimates. [1] [2]
| Rank | County | Per capita income | Median household income | Median family income | Population | Number of households |
|---|---|---|---|---|---|---|
| 1 | Chester | $41,251 | $84,741 | $94,592 | 498,886 | 307,750 |
| 2 | Montgomery | $40,076 | $76,380 | $94,592 | 799,874 | |
| 3 | Bucks | $35,687 | $74,828 | $90,274 | 625,249 | 234,849 |
| 4 | Delaware | $32,067 | $61,876 | $77,879 | 558,979 | 208,700 |
| 5 | Cumberland | $30,119 | $60,219 | $75,000 | 235,406 | 93,943 |
| 6 | Allegheny | $29,549 | $47,961 | $65,678 | 1,223,348 | 533,960 |
| 7 | Butler | $28,446 | $56,878 | $69,464 | 183,862 | 72,835 |
| 8 | Northampton | $28,362 | $58,762 | $70,457 | 297,735 | 113,565 |
| 9 | Dauphin | $27,727 | $52,371 | $66,023 | 268,100 | 110,435 |
| 10 | Pike | $27,564 | $56,843 | $62,982 | 57,369 | 21,925 |
| United States | $27,334 | $51,914 | $62,982 | 308,745,538 | 116,716,292 | |
| 11 | Lehigh | $27,301 | $53,541 | $66,004 | 349,497 | 133,983 |
| 12 | York | $27,196 | $57,494 | $67,624 | 434,972 | 168,372 |
| Pennsylvania | $27,049 | $50,398 | $63,364 | 12,702,379 | 5,018,904 | |
| 13 | Montour | $26,124 | $45,255 | $57,011 | 18,267 | 7,393 |
| 14 | Washington | $26,045 | $49,687 | $63,690 | 207,820 | 85,089 |
| 15 | Lancaster | $25,854 | $54,765 | $64,672 | 519,445 | 193,602 |
| 16 | Westmoreland | $25,845 | $47,689 | $60,987 | 365,169 | 153,650 |
| 17 | Adams | $25,606 | $56,529 | $66,222 | 101,407 | 38,013 |
| 18 | Lebanon | $25,525 | $52,356 | $62,174 | 133,568 | 52,258 |
| 19 | Berks | $25,518 | $53,470 | $63,724 | 411,442 | 154,356 |
| 20 | Franklin | $25,307 | $51,035 | $61,410 | 149,618 | 58,389 |
| 21 | Monroe | $24,824 | $56,733 | $64,763 | 169,842 | 61,091 |
| 22 | Beaver | $24,168 | $46,190 | $57,201 | 170,539 | 71,383 |
| 23 | Lackawanna | $24,152 | $43,673 | $57,846 | 214,437 | 87,226 |
| 24 | Centre | $23,744 | $47,016 | $65,121 | 153,990 | 57,573 |
| 25 | Perry | $23,701 | $52,659 | $61,221 | 45,969 | 17,903 |
| 26 | Luzerne | $23,245 | $42,224 | $54,843 | 320,918 | 131,932 |
| 27 | Carbon | $22,956 | $47,744 | $54,918 | 65,249 | 26,684 |
| 28 | Wyoming | $22,899 | $47,403 | $56,957 | 28,276 | 11,237 |
| 29 | Blair | $22,880 | $42,363 | $53,166 | 127,089 | 52,159 |
| 30 | Elk | $22,729 | $43,745 | $51,889 | 31,946 | 13,693 |
| 31 | Erie | $22,644 | $43,595 | $56,144 | 280,566 | 110,413 |
| 32 | Wayne | $22,525 | $45,930 | $53,665 | 52,822 | 20,625 |
| 33 | Columbia | $22,403 | $42,788 | $52,959 | 67,295 | 26,479 |
| 34 | Susquehanna | $22,173 | $43,457 | $51,151 | 43,356 | 17,798 |
| 35 | Warren | $22,170 | $41,286 | $52,587 | 41,815 | 17,767 |
| 36 | Armstrong | $21,828 | $42,752 | $52,085 | 68,941 | 28,713 |
| 37 | Lycoming | $21,802 | $42,689 | $52,124 | 116,111 | 46,700 |
| 38 | Mercer | $21,765 | $42,573 | $54,160 | 116,638 | 46,442 |
| 39 | Fulton | $21,739 | $45,240 | $54,946 | 14,845 | 6,014 |
| 40 | Union | $21,612 | $45,474 | $52,664 | 44,947 | 14,765 |
| 41 | Lawrence | $21,467 | $42,570 | $52,370 | 91,108 | 37,126 |
| 42 | Schuylkill | $21,408 | $42,315 | $53,083 | 148,289 | 60,192 |
| 43 | Cameron | $21,375 | $40,733 | $49,922 | 5,085 | 2,273 |
| 44 | Cambria | $21,278 | $39,574 | $50,900 | 143,679 | 58,950 |
| 45 | Philadelphia | $21,117 | $36,251 | $45,619 | 1,526,006 | 599,736 |
| 46 | Snyder | $21,072 | $44,713 | $51,715 | 39,702 | 14,750 |
| 47 | McKean | $21,022 | $40,097 | $50,000 | 43,450 | 17,183 |
| 48 | Bradford | $20,979 | $40,543 | $50,142 | 62,622 | 25,321 |
| 49 | Juniata | $20,682 | $44,276 | $52,489 | 24,636 | 9,476 |
| 50 | Northumberland | $20,654 | $38,387 | $48,708 | 94,528 | 39,242 |
| 51 | Huntingdon | $20,616 | $41,700 | $51,969 | 45,913 | 17,280 |
| 52 | Potter | $20,594 | $39,196 | $47,995 | 17,457 | 7,227 |
| 53 | Indiana | $20,587 | $40,225 | $51,227 | 88,880 | 35,005 |
| 54 | Bedford | $20,545 | $40,249 | $48,825 | 49,762 | 20,233 |
| 55 | Venango | $20,522 | $39,812 | $48,866 | 54,984 | 22,621 |
| 56 | Crawford | $20,383 | $38,924 | $48,557 | 88,765 | 35,028 |
| 57 | Tioga | $20,358 | $40,338 | $48,382 | 41,981 | 16,727 |
| 58 | Jefferson | $20,305 | $38,406 | $47,051 | 45,200 | 18,561 |
| 59 | Clarion | $20,259 | $40,028 | $50,697 | 39,988 | 16,128 |
| 60 | Greene | $20,258 | $40,498 | $49,488 | 38,686 | 14,724 |
| 61 | Clearfield | $20,142 | $37,130 | $46,735 | 81,642 | 32,288 |
| 62 | Somerset | $19,903 | $39,194 | $48,994 | 77,742 | 31,090 |
| 63 | Sullivan | $19,718 | $36,250 | $48,168 | 6,428 | 2,777 |
| 64 | Clinton | $19,261 | $39,354 | $50,055 | 39,238 | 15,151 |
| 65 | Fayette | $19,209 | $34,796 | $44,114 | 136,606 | 55,997 |
| 66 | Mifflin | $19,085 | $37,539 | $46,598 | 46,682 | 18,743 |
| 67 | Forest | $14,325 | $35,150 | $43,750 | 7,716 | 2,511 |