Results of the 1985 South Australian state election (House of Assembly)

Last updated

South Australian state election, 7 December 1985 [1]
House of Assembly
<< 19821989 >>

Contents

Enrolled voters905,507
Votes cast846,289 Turnout 93.46+0.28
Informal votes29,401Informal3.47–2.31
Summary of votes by party
PartyPrimary votes %SwingSeatsChange
  Labor 393,65248.19+1.9127+ 3
  Liberal 344,33742.15–0.5216– 5
  Democrats 34,7324.25–2.870± 0
  National 14,0561.72–0.601± 0
  Independent Labor 18,6412.28*2+ 2
  Independent 5,3680.66–0.940– 1
  Independent Liberal 5,2240.64*1+ 1
 Other8780.11*0± 0
Total816,888  47 
Two-party-preferred
  Labor 434,32553.17+2.23
  Liberal 382,56346.83–2.23

This is a list of House of Assembly results for the 1985 South Australian state election. [2]

Results by electoral district

Adelaide

1985 South Australian state election: Adelaide
PartyCandidateVotes%±%
Labor Mike Duigan 7,87547.3+4.3
Liberal Michael Wilson 7,84947.2−3.8
Democrats Christopher Wurm9165.5−0.6
Total formal votes16,64097.3
Informal votes4582.7
Turnout 17,09889.4
Two-party-preferred result
Labor Mike Duigan 8,41450.6+3.4
Liberal Michael Wilson 8,22649.4−3.4
Labor hold Swing +3.4

Albert Park

1985 South Australian state election: Albert Park
PartyCandidateVotes%±%
Labor Kevin Hamilton 11,01560.1−0.9
Liberal Bob MacKenzie6,52535.6+1.6
Democrats John Malone7954.3−0.7
Total formal votes18,33596.9
Informal votes5853.1
Turnout 18,92094.2
Two-party-preferred result
Labor Kevin Hamilton 11,53062.9−1.1
Liberal Bob MacKenzie6,80537.1+1.1
Labor hold Swing -1.1

Alexandra

1985 South Australian state election: Alexandra
PartyCandidateVotes%±%
Liberal Ted Chapman 9,93856.0−10.0
Labor John Quirke 5,24129.5+9.5
National Rex Tilbrook1,3637.7+2.7
Democrats David Willson1,2156.8−2.2
Total formal votes17,75794.9
Informal votes9515.1
Turnout 18,70894.1
Two-party-preferred result
Liberal Ted Chapman 11,57765.2−9.8
Labor John Quirke 6,18034.8+9.8
Liberal hold Swing -9.8

Baudin

1985 South Australian state election: Baudin
PartyCandidateVotes%±%
Labor Don Hopgood 10,68160.2+2.2
Liberal Bill Fraser5,83132.9+0.9
Democrats D Perrotin8835.0−5.0
Independent Mort Daly3391.9+1.9
Total formal votes17,73496.2
Informal votes6993.8
Turnout 18,43391.9
Two-party-preferred result
Labor Don Hopgood 11,29663.7+0.7
Liberal Bill Fraser6,43836.3−0.7
Labor hold Swing -0.7

Bragg

1985 South Australian state election: Bragg
PartyCandidateVotes%±%
Liberal Graham Ingerson 11,71965.1−2.9
Labor Phil Robins5,31529.5+7.5
Democrats Alison Dolling 9785.4−4.6
Total formal votes18,01298.0
Informal votes3682.0
Turnout 18,38091.9
Two-party-preferred result
Liberal Graham Ingerson 12,16667.5−5.5
Labor Phil Robins5,84632.5+5.5
Liberal hold Swing -5.5

Briggs

1985 South Australian state election: Briggs
PartyCandidateVotes%±%
Labor Mike Rann 9,14256.6−4.4
Liberal Bernhard Buchner4,43027.4−2.6
Independent David Whiting1,81811.3+11.3
Democrats Anastasios Giannouklas7664.7−4.3
Total formal votes16,15695.9
Informal votes6874.1
Turnout 16,84392.8
Two-party-preferred result
Labor Mike Rann 10,89467.4+1.4
Liberal Bernhard Buchner5,26232.6−1.4
Labor hold Swing +1.4

Bright

1985 South Australian state election: Bright
PartyCandidateVotes%±%
Labor Derek Robertson 9,04849.5+3.5
Liberal John Mathwin 8,56946.8−0.1
Democrats Fred Cannon6743.7−3.3
Total formal votes18,29197.9
Informal votes3902.1
Turnout 18,68195.3
Two-party-preferred result
Labor Derek Robertson 9,43051.6+2.6
Liberal John Mathwin 8,86148.4−2.6
Labor gain from Liberal Swing +2.6

Chaffey

1985 South Australian state election: Chaffey
PartyCandidateVotes%±%
Liberal Peter Arnold 10,93763.5+1.5
Labor Bill Parsons5,42831.5+1.5
Democrats Rilda Sharp8474.9−3.1
Total formal votes17,21297.6
Informal votes4272.4
Turnout 17,63989.9
Two-party-preferred result
Liberal Peter Arnold 11,41566.3+0.3
Labor Bill Parsons5,79733.7−0.3
Liberal hold Swing +0.3

Coles

1985 South Australian state election: Coles
PartyCandidateVotes%±%
Liberal Jennifer Adamson 8,85554.7−0.3
Labor Ray Rains6,23338.5+1.5
Democrats Sandra Nichols9495.9−2.1
Independent Aniello Carbone1420.9+0.9
Total formal votes16,17996.6
Informal votes5763.4
Turnout 16,75593.8
Two-party-preferred result
Liberal Jennifer Adamson 9,44558.4−0.6
Labor Ray Rains6,73441.6+0.6
Liberal hold Swing -0.6

Custance

1985 South Australian state election: Custance
PartyCandidateVotes%±%
Liberal John Olsen 10,61163.0−1.0
Labor Arthur Rich5,23631.0+3.0
Democrats John Smyth1,0106.0+1.0
Total formal votes16,85797.6
Informal votes4122.4
Turnout 17,26995.2
Two-party-preferred result
Liberal John Olsen 11,18466.3−3.7
Labor Arthur Rich5,67333.7+3.7
Liberal hold Swing -3.7

Davenport

1985 South Australian state election: Davenport
PartyCandidateVotes%±%
Liberal Dean Brown 6,99140.6−25.4
Independent Liberal Stan Evans 5,22430.3+30.3
Labor Mark Boughey4,30725.0+3.0
Democrats Kevin Angove7114.1−7.9
Total formal votes17,23398.2
Informal votes3091.8
Turnout 17,54293.7
Two-party-preferred result
Liberal Dean Brown 11,94369.3−2.7
Labor Mark Boughey5,29030.7+2.7
Two-candidate-preferred result
Independent Liberal Stan Evans 9,06252.6+52.6
Liberal Dean Brown 8,17147.4−24.6
Independent Liberal gain from Liberal Swing +52.6

Elizabeth

1985 South Australian state election: Elizabeth
PartyCandidateVotes%±%
Labor Sonia Argirov6,50843.0−26.0
Independent Labor Martyn Evans 5,50036.2+36.2
Liberal Josephine Gapper2,69217.8−2.2
Democrats Carolyn Tan4523.0−8.0
Total formal votes15,15296.1
Informal votes6103.9
Turnout 15,76292.6
Two-party-preferred result
Labor Sonia Argirov11,06173.0−1.0
Liberal Josephine Gapper4,09127.0+1.0
Two-candidate-preferred result
Independent Labor Martyn Evans 8,17954.0+54.0
Labor Sonia Argirov6,97346.0−28.0
Independent Labor gain from Labor Swing +54.0

Eyre

1985 South Australian state election: Eyre
PartyCandidateVotes%±%
Liberal Graham Gunn 9,57763.8−0.2
Labor Jennie Lee4,78131.8−3.2
Democrats Jillian Polkinghorne6564.4+3.4
Total formal votes15,01495.6
Informal votes6924.4
Turnout 15,70688.9
Two-party-preferred result
Liberal Graham Gunn 9,87965.8+0.8
Labor Jennie Lee5,13534.2−0.8
Liberal hold Swing +0.8

Fisher

1985 South Australian state election: Fisher
PartyCandidateVotes%±%
Labor Philip Tyler 9,90848.4+6.7
Liberal Grant Chapman 9,61246.9+0.7
Democrats Audrey Sibly9614.7−7.4
Total formal votes20,48198.1
Informal votes3871.9
Turnout 20,86894.9
Two-party-preferred result
Labor Philip Tyler 10,46951.1+3.2
Liberal Grant Chapman 10,01248.9−3.2
Labor gain from Liberal Swing +3.2

Flinders

1985 South Australian state election: Flinders
PartyCandidateVotes%±%
National Peter Blacker 6,86439.4−12.6
Liberal Arthur Whyte 6,74038.7+14.7
Labor Terrence Krieg3,44619.8−3.2
Democrats George Jukes3802.2+1.2
Total formal votes17,43098.1
Informal votes3311.9
Turnout 17,76194.0
Two-party-preferred result
Liberal Arthur Whyte 12,93374.2−0.8
Labor Terrence Krieg4,49725.8+0.8
Two-candidate-preferred result
National Peter Blacker 10,16158.3
Liberal Arthur Whyte 7,26941.7
National hold Swing N/A

Florey

1985 South Australian state election: Florey
PartyCandidateVotes%±%
Labor Bob Gregory 9,96155.5+2.5
Liberal Martin Luther7,04739.3−0.7
Democrats Andrew Sickerdick9345.2−0.8
Total formal votes17,94297.1
Informal votes5372.9
Turnout 18,47995.0
Two-party-preferred result
Labor Bob Gregory 10,45058.2+2.2
Liberal Martin Luther7,49241.8−2.2
Labor hold Swing +2.2

Gilles

1985 South Australian state election: Gilles
PartyCandidateVotes%±%
Labor Jack Slater 10,08360.6+3.6
Liberal Lois Bell5,49233.00.0
Democrats Brian Fain1,0726.4−3.6
Total formal votes16,64796.4
Informal votes6293.6
Turnout 17,27694.4
Two-party-preferred result
Labor Jack Slater 10,68964.2+2.2
Liberal Lois Bell5,95835.8−2.2
Labor hold Swing +2.2

Goyder

1985 South Australian state election: Goyder
PartyCandidateVotes%±%
Liberal John Meier 11,53359.6+2.6
Labor Michael Wright 6,93235.8+5.8
Democrats Rosemary Dow8984.6+1.6
Total formal votes19,36397.4
Informal votes5182.6
Turnout 19,88195.0
Two-party-preferred result
Liberal John Meier 12,07762.4−5.6
Labor Michael Wright 7,28637.6+5.6
Liberal hold Swing -5.6

Hanson

1985 South Australian state election: Hanson
PartyCandidateVotes%±%
Liberal Heini Becker 8,55248.9−2.1
Labor Ann Pengelly8,28947.4+5.4
Democrats Ian Haines6503.7−3.3
Total formal votes17,49197.3
Informal votes4882.7
Turnout 17,97993.7
Two-party-preferred result
Liberal Heini Becker 8,89550.9−3.1
Labor Ann Pengelly8,59649.1+3.1
Liberal hold Swing -3.1

Hartley

1985 South Australian state election: Hartley
PartyCandidateVotes%±%
Labor Terry Groom 10,34759.6+7.6
Liberal Rilka Warbanoff6,11435.2−1.0
Democrats Cathi Tucker-Lee9115.2−6.5
Total formal votes17,37295.9
Informal votes7404.1
Turnout 18,11293.4
Two-party-preferred result
Labor Terry Groom 10,85362.5+3.5
Liberal Rilka Warbanoff6,51937.5−3.5
Labor hold Swing +3.5

Hayward

1985 South Australian state election: Hayward
PartyCandidateVotes%±%
Labor June Appleby 8,67850.1+3.1
Liberal Julian Glynn7,73044.6−2.4
Democrats John Stapledon9085.2−0.8
Total formal votes17,31697.7
Informal votes4052.3
Turnout 17,72195.0
Two-party-preferred result
Labor June Appleby 9,14652.8+2.8
Liberal Julian Glynn8,17047.2−2.8
Labor hold Swing +2.8

Henley Beach

1985 South Australian state election: Henley Beach
PartyCandidateVotes%±%
Labor Don Ferguson 9,87654.6+2.6
Liberal Bob Randall 7,20439.8−3.2
Democrats Gladys Wells7534.2−0.8
Independent Joe Rossi 2641.4+1.4
Total formal votes18,09796.8
Informal votes5953.2
Turnout 18,69294.5
Two-party-preferred result
Labor Don Ferguson 10,37357.3+3.3
Liberal Bob Randall 7,72442.7−3.3
Labor hold Swing +3.3

Heysen

1985 South Australian state election: Heysen
PartyCandidateVotes%±%
Liberal David Wotton 9,41854.4−2.6
Labor Elizabeth Harvey 6,49737.5+4.5
Democrats Merilyn Pedrick1,0956.3−3.7
National Douglas Lindley3041.8+1.8
Total formal votes17,31497.4
Informal votes4602.6
Turnout 17,77493.1
Two-party-preferred result
Liberal David Wotton 10,17558.8−3.2
Labor Elizabeth Harvey 7,13941.2+3.2
Liberal hold Swing -3.2

Kavel

1985 South Australian state election: Kavel
PartyCandidateVotes%±%
Liberal Roger Goldsworthy 10,84259.5+2.5
Labor Lance Jones6,38035.0−3.0
Independent Paul Reader1,0025.5+5.5
Total formal votes18,22497.0
Informal votes5553.0
Turnout 18,77993.5
Two-party-preferred result
Liberal Roger Goldsworthy 11,25061.8+1.8
Labor Lance Jones6,97438.2−1.8
Liberal hold Swing +1.8

Light

1985 South Australian state election: Light
PartyCandidateVotes%±%
Liberal Bruce Eastick 10,01255.6−6.4
Labor Tony Piccolo 6,75637.5+4.5
Democrats Nicholas Wedge8284.6−0.4
Independent Eric Gerlach4102.3+2.3
Total formal votes18,00695.4
Informal votes8774.6
Turnout 18,88394.5
Two-party-preferred result
Liberal Bruce Eastick 10,67559.3−5.7
Labor Tony Piccolo 7,33140.7+5.7
Liberal hold Swing -5.7

Mawson

1985 South Australian state election: Mawson
PartyCandidateVotes%±%
Labor Susan Lenehan 11,15262.8+5.8
Liberal Raija Havu5,50231.0−5.1
Democrats Tim Wells1,0956.2−0.8
Total formal votes17,74997.1
Informal votes5282.9
Turnout 18,27792.7
Two-party-preferred result
Labor Susan Lenehan 11,74066.1+5.1
Liberal Raija Havu6,00933.9−5.1
Labor hold Swing +5.1

Mitcham

1985 South Australian state election: Mitcham
PartyCandidateVotes%±%
Liberal Stephen Baker 9,85955.5+6.5
Labor Barbara Hughes6,68937.6+8.6
Democrats Guy Harley1,2306.9−15.1
Total formal votes17,77896.9
Informal votes5783.1
Turnout 18,35692.9
Two-party-preferred result
Liberal Stephen Baker 10,36858.3−1.7
Labor Barbara Hughes7,41041.7+1.7
Liberal hold Swing -1.7

Mitchell

1985 South Australian state election: Mitchell
PartyCandidateVotes%±%
Labor Ron Payne 10,40860.8+3.8
Liberal Mark Hanckel5,87634.4−2.6
Democrats Peter Mann8214.8−1.2
Total formal votes17,10596.4
Informal votes6363.6
Turnout 17,74194.0
Two-party-preferred result
Labor Ron Payne 10,86463.5+3.5
Liberal Mark Hanckel6,24136.5−3.5
Labor hold Swing +3.5

Morphett

1985 South Australian state election: Morphett
PartyCandidateVotes%±%
Liberal John Oswald 8,98752.7−2.3
Labor Trevor Peikert7,32943.0+3.0
Democrats Sue Carver7254.3−0.7
Total formal votes17,04197.3
Informal votes4762.7
Turnout 17,51793.8
Two-party-preferred result
Liberal John Oswald 9,31854.7−2.3
Labor Trevor Peikert7,72345.3+2.3
Liberal hold Swing -2.3

Mount Gambier

1985 South Australian state election: Mount Gambier
PartyCandidateVotes%±%
Liberal Harold Allison 10,29258.9+8.9
Labor Peter Humphries6,78938.9−6.1
Democrats Glenn Taylor3802.2−2.8
Total formal votes17,46197.2
Informal votes5102.8
Turnout 17,97195.9
Two-party-preferred result
Liberal Harold Allison 10,45759.9+6.9
Labor Peter Humphries7,00440.1−6.9
Liberal hold Swing +6.9

Murray-Mallee

1985 South Australian state election: Murray-Mallee
PartyCandidateVotes%±%
Liberal Peter Lewis 10,45458.2−3.8
Labor Peter Dickson5,06828.2+3.2
National Gavin Doecke1,5628.7−2.3
Independent Steve Wilkinson5152.9+2.9
Democrats Don French3672.00.0
Total formal votes17,96697.2
Informal votes5252.8
Turnout 18,49194.0
Two-party-preferred result
Liberal Peter Lewis 12,31968.6+0.6
Labor Peter Dickson5,64731.4−0.6
Liberal hold Swing +0.6

Napier

1985 South Australian state election: Napier
PartyCandidateVotes%±%
Labor Terry Hemmings 10,74466.8+1.8
Liberal Brenda Bates3,35020.8−2.2
Independent John Campbell1,3178.2+8.2
Democrats Barbara Barlow6664.1−7.9
Total formal votes16,07795.9
Informal votes6934.1
Turnout 16,77092.4
Two-party-preferred result
Labor Terry Hemmings 11,81473.5+2.5
Liberal Brenda Bates4,26326.5−2.5
Labor hold Swing +2.5

Newland

1985 South Australian state election: Newland
PartyCandidateVotes%±%
Labor Di Gayler 9,21349.1+3.1
Liberal Scott Ashenden 8,70846.4−1.6
Democrats Mike Bolt8514.5−0.5
Total formal votes18,77297.6
Informal votes4592.4
Turnout 19,23195.0
Two-party-preferred result
Labor Di Gayler 9,66551.5+2.5
Liberal Scott Ashenden 9,10748.5−2.5
Labor hold Swing +2.5

Norwood

1985 South Australian state election: Norwood
PartyCandidateVotes%±%
Labor Greg Crafter 8,99053.2+0.2
Liberal Sue Graham7,07441.8+0.8
Democrats Rodney Roberts8485.0−1.0
Total formal votes16,91297.3
Informal votes4792.7
Turnout 17,39192.4
Two-party-preferred result
Labor Greg Crafter 9,52656.3+0.3
Liberal Sue Graham7,38643.7−0.3
Labor hold Swing +0.3

Peake

1985 South Australian state election: Peake
PartyCandidateVotes%±%
Labor Keith Plunkett 10,59361.9−3.1
Liberal Steve Peake5,40131.6+1.6
Democrats Jeff Wild7944.6−1.4
Independent Ian Frances3131.8+1.8
Total formal votes17,10193.0
Informal votes1,2947.0
Turnout 18,39593.5
Two-party-preferred result
Labor Keith Plunkett 11,23265.7−1.3
Liberal Steve Peake5,86934.3+1.3
Labor hold Swing -1.3

Playford

1985 South Australian state election: Playford
PartyCandidateVotes%±%
Labor Terry McRae 11,28966.3+6.3
Liberal Dorothy Kotz 4,78228.1−2.9
Democrats Eileen Farmer9555.6−3.4
Total formal votes17,02693.9
Informal votes1,1046.1
Turnout 18,13094.0
Two-party-preferred result
Labor Terry McRae 11,81069.4+5.4
Liberal Dorothy Kotz 5,21630.6−5.4
Labor hold Swing +5.4

Price

1985 South Australian state election: Price
PartyCandidateVotes%±%
Labor Murray De Laine 12,16369.4−4.6
Liberal Jean Lawrie4,14423.7−1.3
Democrats Don Bond1,2166.9+5.9
Total formal votes17,52394.8
Informal votes9615.2
Turnout 18,48492.9
Two-party-preferred result
Labor Murray De Laine 13,02574.3−0.7
Liberal Jean Lawrie4,49825.7+0.7
Labor hold Swing -0.7

Ramsay

1985 South Australian state election: Ramsay
PartyCandidateVotes%±%
Labor Lynn Arnold 12,95974.2+3.2
Liberal Jim Davis4,51625.8+3.8
Total formal votes17,47595.4
Informal votes8394.6
Turnout 18,31493.5
Labor hold Swing +0.2

Ross Smith

1985 South Australian state election: Ross Smith
PartyCandidateVotes%±%
Labor John Bannon 11,41565.9−1.1
Liberal Darryl Watson5,10629.5−1.5
Democrats Kate Hannaford7904.6+2.6
Total formal votes17,31196.1
Informal votes6963.9
Turnout 18,00793.9
Two-party-preferred result
Labor John Bannon 11,89568.7+0.7
Liberal Darryl Watson5,41631.3−0.7
Labor hold Swing +0.7

Semaphore

1985 South Australian state election: Semaphore
PartyCandidateVotes%±%
Independent Labor Norm Peterson 7,22641.7−3.3
Labor Rod Sawford 7,10441.0+15.0
Liberal Mark Laing2,83116.3−11.7
Democrats F Goncalves1771.0+1.0
Total formal votes17,33897.1
Informal votes5262.9
Turnout 17,86494.4
Two-candidate-preferred result
Independent Labor Norm Peterson 9,93957.3
Labor Rod Sawford 7,39942.7
Independent Labor hold Swing N/A

Spence

1985 South Australian state election: Spence
PartyCandidateVotes%±%
Labor Roy Abbott 11,34964.8−6.2
Liberal Joe Ryan5,23129.8+2.9
Democrats Elizabeth Sanderson9425.4+3.4
Total formal votes17,52296.0
Informal votes7274.0
Turnout 18,24993.3
Two-party-preferred result
Labor Roy Abbott 11,97868.4−3.6
Liberal Joe Ryan5,54431.6+3.6
Labor hold Swing -3.6

Stuart

1985 South Australian state election: Stuart
PartyCandidateVotes%±%
Labor Gavin Keneally 11,16467.5−2.5
Liberal Bob Smith4,13024.9+3.0
Independent Peter Clark7284.4+4.4
Democrats Harm Folkers5263.2−4.8
Total formal votes16,54893.0
Informal votes1,2377.0
Turnout 17,78594.2
Two-party-preferred result
Labor Gavin Keneally 11,92072.0−2.0
Liberal Bob Smith4,62828.0+2.0
Labor hold Swing -2.0

Todd

1985 South Australian state election: Todd
PartyCandidateVotes%±%
Labor John Klunder 9,20353.2+3.3
Liberal Jeff Nicholas7,28742.2−2.8
Democrats Aussie Kanck7924.6−0.4
Total formal votes17,28296.7
Informal votes5823.3
Turnout 17,86494.7
Two-party-preferred result
Labor John Klunder 9,66955.9+3.9
Liberal Jeff Nicholas7,61344.1−3.9
Labor gain from Liberal Swing +3.9

Unley

1985 South Australian state election: Unley
PartyCandidateVotes%±%
Labor Kym Mayes 8,79751.2+1.3
Liberal Denis Sheridan7,31442.6−2.5
Nuclear Disarmament Barbara Boden6854.0+4.0
Independent Peter Kallas3852.2+2.2
Total formal votes17,18196.7
Informal votes5903.3
Turnout 17,77190.8
Two-party-preferred result
Labor Kym Mayes 9,44455.0+3.0
Liberal Denis Sheridan7,73745.0−3.0
Labor hold Swing +3.0

Victoria

1985 South Australian state election: Victoria
PartyCandidateVotes%±%
Liberal Dale Baker 9,07449.4−10.6
Labor Bill Hender4,97227.1−1.9
National Geoff Clothier3,79720.7+12.7
Democrats Roy Milne5182.8+0.2
Total formal votes18,36196.5
Informal votes6623.5
Turnout 19,02394.5
Two-party-preferred result
Liberal Dale Baker 12,54968.3+0.3
Labor Bill Hender5,81231.7−0.3
Liberal hold Swing +0.3

Walsh

1985 South Australian state election: Walsh
PartyCandidateVotes%±%
Labor John Trainer 9,42256.7+2.7
Liberal Lenore Triplow5,70934.3−4.7
Independent Reece Jennings8685.2+5.2
Democrats Helen Brasted6293.8−3.2
Total formal votes16,62894.4
Informal votes9805.6
Turnout 17,60892.7
Two-party-preferred result
Labor John Trainer 10,09160.7+2.7
Liberal Lenore Triplow6,53739.3−2.7
Labor hold Swing +2.7

Whyalla

1985 South Australian state election: Whyalla
PartyCandidateVotes%±%
Labor Frank Blevins 8,87753.9−7.1
Liberal Laurie Wilks3,89023.6+4.6
Independent Labor Peter Murphy2,78016.9+0.9
Democrats Graham Gloede3452.1+2.1
Independent Andy Fleming2251.4+1.4
Nuclear Disarmament Jack Berry1931.2+1.2
National Fred Wilson1661.0+1.0
Total formal votes16,47696.3
Informal votes6333.7
Turnout 17,10992.2
Two-party-preferred result
Labor Frank Blevins 11,04767.0−8.0
Liberal Laurie Wilks5,42933.0+8.0
Labor hold Swing -8.0

See also

Related Research Articles

<span class="mw-page-title-main">2001 Queensland state election</span>

The 2001 Queensland state election was held on 17 February 2001 to elect the 89 members of the state's Legislative Assembly. The result of the election was the return of the Labor Party (ALP) government of Premier Peter Beattie, with an increased majority in a landslide. Labor won 66 seats, easily the most it has ever won in Queensland and one of Labor's best-ever results nationwide. There was a 10.07% swing towards Labor, while One Nation suffered a 13.98% swing against it, losing eight seats.
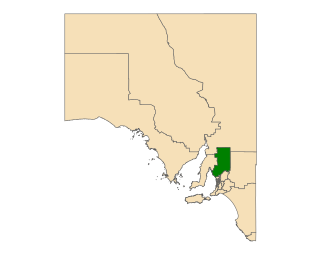
<span class="mw-page-title-main">Electoral district of Adelaide</span> South Australian state electoral district

Adelaide is a single-member electoral district for the South Australian House of Assembly. The 22.8 km² state seat of Adelaide currently consists of the Adelaide city centre including North Adelaide and suburbs to the inner north and inner north east: Collinswood, Fitzroy, Gilberton, Medindie, Medindie Gardens, Ovingham, Thorngate, Walkerville, most of Prospect, and part of Nailsworth. The federal division of Adelaide covers the state seat of Adelaide and additional suburbs in each direction.

<span class="mw-page-title-main">Electoral district of Frome</span> Australian electorate

Frome is a single-member electoral district for the South Australian House of Assembly. It is named after Edward Charles Frome, the third surveyor-general of South Australia. The electorate stretches north-eastwards from the Gawler River and Gulf St Vincent in the south, and includes many of the agricultural areas of the Clare and Gilbert Valleys. It covers a total of 12,921 km2 (4,989 sq mi) and takes in the towns of Auburn, Clare, Mintaro, Port Broughton, Saddleworth, Snowtown and Riverton. Prior to the 2020 redistribution, its main population centre was Port Pirie, since transferred to Stuart.

<span class="mw-page-title-main">Electoral district of Fisher</span> Former state electoral district of South Australia

Fisher was an electoral district of the House of Assembly in the Australian state of South Australia. It was created in 1970 and named after Sir James Fisher, a colonial politician and the first mayor of Adelaide. It was abolished in a 2016 redistribution and its last MP, Nat Cook was elected to represent its replacement, Hurtle Vale, at the 2018 state election. It covers a 94.2 km2 suburban and semi rural area on the southern fringes of Adelaide, taking in the suburbs of Aberfoyle Park, Chandlers Hill, Cherry Gardens, Coromandel East, Happy Valley, Reynella East and parts of Clarendon, O'Halloran Hill and Woodcroft.

<span class="mw-page-title-main">1992 Queensland state election</span> Australian state elections; won by Labour

Elections were held in the Australian state of Queensland on 19 September 1992 to elect the 89 members of the state's Legislative Assembly.

<span class="mw-page-title-main">Electoral district of Maylands</span> State electoral district of Western Australia

Maylands is a Legislative Assembly electorate in the state of Western Australia. Maylands is named for the inner northeastern Perth suburb of Maylands, which falls within its borders.
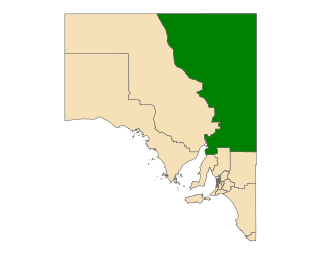
<span class="mw-page-title-main">Electoral district of Stuart</span> State electoral district of South Australia

Stuart is a single-member electoral district for the South Australian House of Assembly. At 323,131 km², it is a vast country district extending from the Spencer Gulf as far as the Northern Territory border in the north and the Queensland and New South Wales borders in the east. The district includes pastoral lease and unincorporated Crown Lands, Lake Eyre and part of the Simpson Desert in the far north. Its main population centres since the 2020 boundaries redistribution are the industrial towns of Port Pirie and Port Augusta.

<span class="mw-page-title-main">1986 Queensland state election</span>

Elections were held in the Australian state of Queensland on 1 November 1986 to elect the 89 members of the state's Legislative Assembly. It followed a redistribution which increased the number of seats in the Assembly from 82 to 89.
<span class="mw-page-title-main">1977 South Australian state election</span>

State elections were held in South Australia on 17 September 1977. All 47 seats in the South Australian House of Assembly were up for election. The incumbent Australian Labor Party led by Premier of South Australia Don Dunstan won a fourth term in government, defeating the Liberal Party of Australia led by Leader of the Opposition David Tonkin.

<span class="mw-page-title-main">2009 Queensland state election</span>


The 2009 Queensland state election was held on 21 March 2009 to elect all 89 members of the Legislative Assembly, a unicameral parliament.

This article provides information on candidates who stood for the 1949 Australian federal election. The election was held on 10 December 1949.

This article provides information on candidates who stood for the 1969 Australian federal election. The election was held on 25 October 1969.

This article provides information on candidates who stood for the 1984 Australian federal election. The election was held on 1 December 1984.

<span class="mw-page-title-main">1962 New South Wales state election</span> State election for New South Wales, Australia in March 1962

The 1962 New South Wales state election was held on 3 March 1962. It was conducted in single member constituencies with compulsory preferential voting and was held on boundaries created at a 1961 redistribution. The election was for all of the 94 seats in the Legislative Assembly.

Bligh, an electoral district of the Legislative Assembly in the Australian state of New South Wales was created in 1962 and abolished in 2007.

This is a list of House of Assembly results for the 1993 South Australian state election.

<span class="mw-page-title-main">Electoral district of Dunstan</span> State electoral district of South Australia

Dunstan is a single-member electoral district for the South Australian House of Assembly, covering the inner eastern suburbs of Beulah Park, College Park, Evandale, Firle, Hackney, Joslin, Kensington, Kensington Park, Kensington Gardens, Kent Town, Marden, Maylands, Norwood, Payneham, Payneham South, Royston Park, St Morris, St Peters, Stepney, and Trinity Gardens.

<span class="mw-page-title-main">2018 South Australian state election</span>

The 2018 South Australian state election to elect members to the 54th Parliament of South Australia was held on 17 March 2018. All 47 seats in the House of Assembly or lower house, whose members were elected at the 2014 election, and 11 of 22 seats in the Legislative Council or upper house, last filled at the 2010 election, were contested. The record-16-year-incumbent Australian Labor Party (SA) government led by Premier Jay Weatherill was seeking a fifth four-year term, but was defeated by the opposition Liberal Party of Australia (SA), led by Opposition Leader Steven Marshall. Nick Xenophon's new SA Best party unsuccessfully sought to obtain the balance of power.

The 1993 South Australian state election was held on 11 December 1993.

<span class="mw-page-title-main">2022 South Australian state election</span>

The 2022 South Australian state election was held on 19 March 2022 to elect members to the 55th Parliament of South Australia. All 47 seats in the House of Assembly, and half the seats in the Legislative Council were up for re-election.

References

  1. "Details of SA 1985 Election". Australian Politics and Elections Database.
  2. Jaensch, Dean (1986). The 1985 elections in South Australia : a statistical analysis. Klemzig, S. Aust.: Polity Publications. ISBN   0949094005.