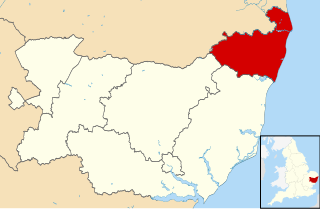
The 2000 Waveney Council election took place on 4 May 2000 to elect members of Waveney District Council in Suffolk, England. One third of the council was up for election and the Labour party stayed in overall control of the council. [1]
Waveney was a local government district in Suffolk, England, named after the River Waveney that forms its north-east border. The district council was based in Lowestoft, the major settlement in Waveney. The other towns in the district are Beccles, Bungay, Halesworth and Southwold.
Non-metropolitan districts, or colloquially "shire districts", are a type of local government district in England. As created, they are sub-divisions of non-metropolitan counties in a two-tier arrangement.
Suffolk is an East Anglian county of historic origin in England. It has borders with Norfolk to the north, Cambridgeshire to the west and Essex to the south. The North Sea lies to the east. The county town is Ipswich; other important towns include Lowestoft, Bury St Edmunds, Newmarket and Felixstowe, one of the largest container ports in Europe.
After the election, the composition of the council was
The Labour Party is a centre-left political party in the United Kingdom that has been described as an alliance of social democrats, democratic socialists and trade unionists. The party's platform emphasises greater state intervention, social justice and strengthening workers' rights.
The Conservative Party, officially the Conservative and Unionist Party, is a centre-right political party in the United Kingdom. The governing party since 2010, it is the largest in the House of Commons, with 313 Members of Parliament, and also has 249 members of the House of Lords, 18 members of the European Parliament, 31 Members of the Scottish Parliament, 12 members of the Welsh Assembly, eight members of the London Assembly and 8,916 local councillors.
The Liberal Democrats are a liberal political party in the United Kingdom. It is currently led by Vince Cable. They have 11 Members of Parliament in the House of Commons, 96 members of the House of Lords, one member of the European Parliament, five Members of the Scottish Parliament and one member in the Welsh Assembly and London Assembly. At the height of its influence, the party formed a coalition government with the Conservative Party from 2010 to 2015 with its leader Nick Clegg serving as Deputy Prime Minister.
Party | Seats | Gains | Losses | Net gain/loss | Seats % | Votes % | Votes | +/− | |
---|---|---|---|---|---|---|---|---|---|
Conservative | 9 | +8 | 56.3 | 39.6 | 9,360 | +7.5% | |||
Labour | 4 | -9 | 25.0 | 37.4 | 8,838 | -13.3% | |||
Liberal Democrat | 2 | +1 | 12.5 | 18.2 | 4,302 | +6.4% | |||
Independent | 1 | 0 | 6.3 | 4.8 | 1,130 | +2.8% |
Party | Candidate | Votes | % | ± | |
---|---|---|---|---|---|
Liberal Democrat | Eileen Crisp | 899 | 43.9 | +32.5 | |
Conservative | Keith Standring | 642 | 31.3 | +11.2 | |
Labour | Peter Shelley | 509 | 24.8 | -12.8 | |
Majority | 257 | 12.5 | |||
Turnout | 2,050 |
Party | Candidate | Votes | % | ± | |
---|---|---|---|---|---|
Conservative | Shirley Cole | 735 | 51.6 | +15.4 | |
Labour | William Mason | 503 | 35.3 | -14.8 | |
Liberal Democrat | Nicholas Bromley | 186 | 13.1 | -0.6 | |
Majority | 232 | 16.3 | |||
Turnout | 1,424 |
Party | Candidate | Votes | % | ± | |
---|---|---|---|---|---|
Conservative | John Groom | 705 | 46.5 | +12.5 | |
Labour | David Jermy | 696 | 45.9 | -8.4 | |
Liberal Democrat | Darren Ware | 115 | 7.6 | -4.1 | |
Majority | 9 | 0.6 | |||
Turnout | 1,516 |
Party | Candidate | Votes | % | ± | |
---|---|---|---|---|---|
Conservative | Bernard Reader | 882 | 50.5 | +19.6 | |
Labour | Jacqueline Wagner | 649 | 37.1 | -13.2 | |
Liberal Democrat | Andrew Thomas | 216 | 12.4 | +3.9 | |
Majority | 233 | 13.3 | |||
Turnout | 1,747 |
Party | Candidate | Votes | % | ± | |
---|---|---|---|---|---|
Conservative | Ronald Bell | 403 | 33.9 | ||
Independent | James Mitchell | 361 | 30.4 | ||
Labour | Norman Hodges | 301 | 25.3 | ||
Independent | Norman Keable | 62 | 5.2 | ||
Liberal Democrat | Arnold Martin | 61 | 5.1 | ||
Majority | 42 | 3.5 | |||
Turnout | 1,188 |
Party | Candidate | Votes | % | ± | |
---|---|---|---|---|---|
Conservative | Stephen Chilvers | 878 | 53.1 | +10.0 | |
Labour | Gordon Stewart | 597 | 36.1 | -9.7 | |
Liberal Democrat | Antony Tibbitt | 178 | 10.8 | -0.3 | |
Majority | 281 | 17.0 | |||
Turnout | 1,653 |
Party | Candidate | Votes | % | ± | |
---|---|---|---|---|---|
Conservative | Robert Niblett | 570 | 47.0 | +15.0 | |
Labour | Paul Whitlow | 456 | 37.6 | -30.4 | |
Liberal Democrat | Susan Bainer | 186 | 15.3 | +15.3 | |
Majority | 114 | 9.4 | |||
Turnout | 1,212 |
Party | Candidate | Votes | % | ± | |
---|---|---|---|---|---|
Independent | Ruth Ford | 707 | 56.3 | +17.7 | |
Labour | Stella Bostock | 344 | 27.4 | -12.5 | |
Conservative | Stephen Ames | 116 | 9.2 | +0.5 | |
Liberal Democrat | Paul Meadez | 89 | 7.1 | -5.7 | |
Majority | 363 | 28.9 | |||
Turnout | 1,256 |
Party | Candidate | Votes | % | ± | |
---|---|---|---|---|---|
Conservative | Kenneth Sale | 462 | 46.2 | ||
Labour | Kate McGee | 416 | 41.6 | ||
Liberal Democrat | Alison Briggs | 122 | 12.2 | ||
Majority | 46 | 4.6 | |||
Turnout | 1,000 |
Party | Candidate | Votes | % | ± | |
---|---|---|---|---|---|
Liberal Democrat | Gifford Baxter | 652 | 48.5 | -3.0 | |
Labour | Ernest Skepelhorn | 501 | 37.3 | -0.5 | |
Conservative | Shona Reeves | 190 | 14.1 | +3.4 | |
Majority | 151 | 11.2 | -2.5 | ||
Turnout | 1,343 |
Party | Candidate | Votes | % | ± | |
---|---|---|---|---|---|
Labour | Kevin Porter | 586 | 60.5 | -12.6 | |
Conservative | May Reader | 260 | 26.8 | +10.9 | |
Liberal Democrat | Breena Batchelder | 123 | 12.7 | +1.7 | |
Majority | 326 | 33.6 | -23.6 | ||
Turnout | 969 |
Party | Candidate | Votes | % | ± | |
---|---|---|---|---|---|
Conservative | Michael Partridge | 1,127 | 56.1 | +11.1 | |
Labour | Malcolm Cherry | 685 | 34.1 | -11.6 | |
Liberal Democrat | Philip Mummery | 198 | 9.9 | +0.7 | |
Majority | 442 | 22.0 | |||
Turnout | 2,010 |
Party | Candidate | Votes | % | ± | |
---|---|---|---|---|---|
Labour | Ronald Thorne | 816 | 52.0 | -7.9 | |
Conservative | Valerie Pulford | 556 | 35.5 | +4.8 | |
Liberal Democrat | Brian Howe | 196 | 12.5 | +3.2 | |
Majority | 260 | 16.6 | -12.6 | ||
Turnout | 1,568 |
Party | Candidate | Votes | % | ± | |
---|---|---|---|---|---|
Labour | Jonathan Winterton | 820 | 55.9 | -12.5 | |
Conservative | Anne Mylan | 483 | 32.9 | +12.1 | |
Liberal Democrat | Leslie Batchelder | 164 | 11.2 | +0.4 | |
Majority | 337 | 23.0 | -24.7 | ||
Turnout | 1,467 |
Party | Candidate | Votes | % | ± | |
---|---|---|---|---|---|
Conservative | John Goldsmith | 1,085 | 50.3 | -10.0 | |
Liberal Democrat | Michael Ladd | 787 | 36.5 | +36.5 | |
Labour | Kenneth Francis | 284 | 13.2 | -26.5 | |
Majority | 298 | 13.8 | -6.8 | ||
Turnout | 2,156 |
Party | Candidate | Votes | % | ± | |
---|---|---|---|---|---|
Labour | Rita Carter | 675 | 63.0 | -9.6 | |
Conservative | Barry Bee | 266 | 24.8 | +8.5 | |
Liberal Democrat | Sandra Tonge | 130 | 12.1 | +1.0 | |
Majority | 409 | 38.2 | -18.1 | ||
Turnout | 1,071 |
Kirklees is a metropolitan borough of West Yorkshire, England. One third of the Council is elected each election year. Every fourth year there is no election. Since the last boundary changes in 2004, 69 councillors have been elected from 23 wards.
Elections to Durham County Council are held every four years. The council was created as part of the 1972 local government reforms. The first elections to the new authority were held in 1973 in advance of the council taking office in 1974. As part of changes to local government in 2009, the council became a unitary authority with the first elections to the new council taking place in 2008. Since becoming a unitary authority, 126 councillors have been elected from 63 wards.
Sefton Council is the governing body for the Metropolitan Borough of Sefton in Merseyside, north-western England. The council was under no overall control from the 1980s until 2012 when the Labour Party took control. It is a constituent council of Liverpool City Region Combined Authority.
The 1999 Harlow District Council election took place on 6 May 1999 to elect members of Harlow District Council in Essex, England. One third of the council was up for election and the Labour party stayed in overall control of the council.
The 2000 Harlow District Council election took place on 4 May 2000 to elect members of Harlow District Council in Essex, England. One third of the council was up for election and the Labour party stayed in overall control of the council.
The 2000 Wakefield Metropolitan District Council election took place on 4 May 2000 to elect members of Wakefield Metropolitan District Council in West Yorkshire, England. One third of the council was up for election and the Labour party kept overall control of the council.
The 2000 Welwyn Hatfield District Council election took place on 6 May 2000 to elect members of Welwyn Hatfield District Council in Hertfordshire, England. One third of the council was up for election and the Labour party gained overall control of the council from no overall control. Overall turnout in the election was 31.71%, down from 33.09% in the 1999 election.
The 2000 Fareham Council election took place on 4 May 2000 to elect members of Fareham Borough Council in Hampshire, England. One third of the council was up for election and the Conservative party stayed in overall control of the council.
Local elections were held in Waveney district every four years to elect councillors to Waveney District Council. In the past, one-third of councillors were elected each year, but in 2010 the council opted to change to a whole council election system. Since the last boundary changes in 2002, 48 councillors have been elected from 23 wards. The district was merged with Suffolk Coastal in April 2019 to form East Suffolk, meaning that the 2015 elections were the final Waveney elections to be held.
The 1998 Waveney Council election took place on 7 May 1998 to elect members of Waveney District Council in Suffolk, England. One third of the council was up for election and the Labour party stayed in overall control of the council.
The 1999 Waveney Council election took place on 6 May 1999 to elect members of Waveney District Council in Suffolk, England. One third of the council was up for election and the Labour party stayed in overall control of the council.
The 2002 Waveney Council election took place on 2 May 2002 to elect members of Waveney District Council in Suffolk, England. The whole council was up for election with boundary changes since the last election in 2000. The Labour party lost overall control of the council to no overall control.
The 2003 Waveney Council election took place on 1 May 2003 to elect members of Waveney District Council in Suffolk, England. One third of the council was up for election and the council stayed under no overall control.
The 2004 Waveney Council election took place on 10 June 2004 to elect members of Waveney District Council in Suffolk, England. One third of the council was up for election and the council stayed under no overall control.
The 2000 Solihull Metropolitan Borough Council election took place on 4 May 2000 to elect members of Solihull Metropolitan Borough Council in the West Midlands, England. One third of the council was up for election and the Conservative party gained overall control of the council from no overall control.
The 2000 Stroud Council election took place on 4 May 2000 to elect members of Stroud District Council in Gloucestershire, England. One third of the council was up for election and the council stayed under no overall control.
Elections to Waveney District Council took place on Thursday 5 May 2011. This was the first election held as a Whole Council election following a change made to the electoral system in 2010. As a result, all 48 council seats were contested.
The 2000 Carlisle City Council election took place on 4 May 2000 to elect members of Carlisle District Council in Cumbria, England. One third of the council was up for election and the Conservative party stayed in overall control of the council.
The 2015 Waveney District Council election was held on 7 May 2015 to elect all 48 members of Waveney District Council in England. This was on the same day as other local elections.