Elections to West Lindsey District Council were held on 10 June 2004. One third of the council was up for election and the Conservative party gained overall control of the council from no overall control.
West Lindsey is a local government district in Lincolnshire, England.
The Conservative Party, officially the Conservative and Unionist Party, is a centre-right political party in the United Kingdom. The governing party since 2010, it is the largest in the House of Commons, with 313 Members of Parliament, and also has 249 members of the House of Lords, 18 members of the European Parliament, 31 Members of the Scottish Parliament, 12 members of the Welsh Assembly, eight members of the London Assembly and 8,916 local councillors.
In the context of local authorities in the United Kingdom, the term no overall control refers to a situation in which no single political group achieves a majority of seats; and is analogous to a hung parliament. Of the 310 councils who had members up for election in the 2007 local elections, 85 resulted in a NOC administration.
After the election, the composition of the council was
Party | Seats | Gains | Losses | Net gain/loss | Seats % | Votes % | Votes | +/− | |
---|---|---|---|---|---|---|---|---|---|
Liberal Democrat | 9 | 1 | 0 | +1 | 69.2 | 53.7 | 10,412 | +27.1% | |
Conservative | 4 | 2 | 1 | +1 | 30.8 | 35.7 | 6,928 | -2.3% | |
Labour | 0 | 0 | 0 | 0 | 0 | 5.6 | 1,084 | -8.6% | |
Independent | 0 | 0 | 2 | -2 | 0 | 4.9 | 959 | -15.9% | |
One Conservative candidate was unopposed.
Party | Candidate | Votes | % | ± | |
---|---|---|---|---|---|
Conservative | Angela Lawrence | 705 | 61.5 | +29.6 | |
Independent | Norman Hancock | 441 | 38.5 | -21.3 | |
Majority | 264 | 23.0 | -4.9 | ||
Turnout | 1,146 | 44.7 | +7.6 | ||
Conservative gain from Independent | Swing | ||||
Party | Candidate | Votes | % | ± | |
---|---|---|---|---|---|
Liberal Democrat | Adrian Heath | 1,209 | 65.1 | +31.9 | |
Conservative | Keith Deeley | 649 | 34.9 | -18.8 | |
Majority | 560 | 30.2 | +9.7 | ||
Turnout | 1,858 | 56.5 | +14.9 | ||
Liberal Democrat hold | Swing | ||||
Party | Candidate | Votes | % | ± | |
---|---|---|---|---|---|
Conservative | Susan Rawlins | unopposed | |||
Conservative hold | Swing | ||||
Party | Candidate | Votes | % | ± | |
---|---|---|---|---|---|
Liberal Democrat | Michael Tinker | 774 | 48.3 | -25.3 | |
Labour | Deborah Rose | 551 | 34.4 | +34.4 | |
Conservative | Marc Bratcher | 276 | 17.2 | -9.2 | |
Majority | 223 | 13.9 | -33.3 | ||
Turnout | 1,601 | 35.3 | +17.3 | ||
Liberal Democrat hold | Swing | ||||
Party | Candidate | Votes | % | ± | |
---|---|---|---|---|---|
Liberal Democrat | James Snee | 765 | 37.7 | +6.8 | |
Conservative | Paul Howitt-Cowan | 489 | 24.1 | -18.6 | |
Independent | Harry Clarke | 417 | 20.6 | +20.6 | |
Labour | John Indian | 356 | 17.6 | -8.8 | |
Majority | 276 | 13.6 | |||
Turnout | 2,027 | 41.1 | +15.3 | ||
Liberal Democrat hold | Swing | ||||
Party | Candidate | Votes | % | ± | |
---|---|---|---|---|---|
Liberal Democrat | Trevor Young | 690 | 58.0 | -6.9 | |
Conservative | Donald Sweeting | 221 | 18.6 | +6.9 | |
Labour | Catherine Dobson | 177 | 14.9 | +14.9 | |
Independent | William Gabbott | 101 | 8.5 | -14.9 | |
Majority | 469 | 39.4 | -2.1 | ||
Turnout | 1,189 | 35.7 | +10.0 | ||
Liberal Democrat hold | Swing | ||||
Party | Candidate | Votes | % | ± | |
---|---|---|---|---|---|
Liberal Democrat | David Kitchen | 927 | 54.5 | +12.8 | |
Conservative | Carol Skye | 774 | 45.5 | -3.0 | |
Majority | 153 | 9.0 | +2.2 | ||
Turnout | 1,701 | 35.7 | +4.6 | ||
Liberal Democrat hold | Swing | ||||
Party | Candidate | Votes | % | ± | |
---|---|---|---|---|---|
Liberal Democrat | Malcolm Leaning | 1,278 | 64.7 | +64.7 | |
Conservative | Kenneth Davidson | 696 | 35.3 | +10.1 | |
Majority | 582 | 29.4 | -20.2 | ||
Turnout | 1,974 | 55.4 | +19.8 | ||
Liberal Democrat hold | Swing | ||||
Party | Candidate | Votes | % | ± | |
---|---|---|---|---|---|
Liberal Democrat | David Cotton | 1,506 | 76.8 | +76.8 | |
Conservative | William Morgan | 455 | 23.2 | -27.5 | |
Majority | 1,051 | 53.6 | |||
Turnout | 1,961 | 50.9 | +22.1 | ||
Liberal Democrat hold | Swing | ||||
Party | Candidate | Votes | % | ± | |
---|---|---|---|---|---|
Conservative | William Parry | 850 | 54.2 | -20.1 | |
Liberal Democrat | Triloki Mehrota | 719 | 45.8 | +20.1 | |
Majority | 131 | 8.4 | -40.2 | ||
Turnout | 1,569 | 46.1 | +9.6 | ||
Conservative hold | Swing | ||||
Party | Candidate | Votes | % | ± | |
---|---|---|---|---|---|
Liberal Democrat | Reginald Shore | 810 | 78.2 | +7.2 | |
Conservative | Stephen Beer | 226 | 21.8 | -7.2 | |
Majority | 584 | 56.4 | +14.4 | ||
Turnout | 1,036 | 56.5 | +9.2 | ||
Liberal Democrat hold | Swing | ||||
Party | Candidate | Votes | % | ± | |
---|---|---|---|---|---|
Conservative | Stuart Curtis | 656 | 57.5 | ||
Liberal Democrat | Roy Harris | 484 | 42.5 | ||
Majority | 172 | 15.0 | |||
Turnout | 1,140 | 56.0 | |||
Conservative gain from Independent | Swing | ||||
Party | Candidate | Votes | % | ± | |
---|---|---|---|---|---|
Liberal Democrat | Roger Hiscox | 1,250 | 57.3 | +57.3 | |
Conservative | Charles Ireland | 931 | 42.7 | +42.7 | |
Majority | 319 | 14.6 | |||
Turnout | 2,181 | 52.9 | +19.3 | ||
Liberal Democrat gain from Conservative | Swing | ||||
The 2004 West Lancashire District Council election took place on 10 June 2004 to elect members of West Lancashire District Council in Lancashire, England. One third of the council was up for election and the Conservative party stayed in overall control of the council.
The 2006 West Lancashire District Council election took place on 4 May 2006 to elect members of West Lancashire District Council in Lancashire, England. One third of the council was up for election and the Conservative party stayed in overall control of the council.
One third of West Lindsey District Council in Lincolnshire, England is elected each year, followed by one year when there is an election to Lincolnshire County Council instead.
Elections to Rossendale Borough Council were held on 10 June 2004. One third of the council was up for election and the Conservative party gained overall control of the council from no overall control.
Elections to West Lindsey District Council were held on 7 May 1998. One third of the council was up for election and the Liberal Democrat party lost overall control of the council to no overall control.
Elections to West Lindsey District Council in Lincolnshire, England were held on 6 May 1999. The whole council was up for election with boundary changes since the last election in 1998. The council stayed under no overall control.
Elections to West Lindsey District Council were held on 4 May 2000. One third of the council was up for election and the council stayed under no overall control.
Elections to West Lindsey District Council were held on 2 May 2002. One third of the council was up for election and the council stayed under no overall control.
Elections to West Lindsey District Council were held on 1 May 2003. One third of the council was up for election and the council stayed under no overall control.
Elections to West Lindsey District Council were held on 4 May 2006. One third of the council was up for election and the Conservative party lost overall control of the council to no overall control. The Liberal Democrat party took overall control of the council two weeks later after a by-election victory in Lea ward.
Elections to West Lindsey District Council were held on 3 May 2007. One third of the council was up for election and the Liberal Democrat party held overall control of the council after what was seen as a straight fight with the Conservative party.
The 2006 Wyre Forest District Council election took place on 4 May 2006 to elect members of Wyre Forest District Council in Worcestershire, England. One third of the council was up for election and the council stayed under no overall control.
The 2004 Welwyn Hatfield District Council election took place on 10 June 2004 to elect members of Welwyn Hatfield District Council in Hertfordshire, England. One third of the council was up for election and the Conservative party stayed in overall control of the council.
Local elections were held in the United Kingdom on 3 May 1979. The results provided some source of comfort to the Labour Party (UK), who recovered some lost ground from local election reversals in previous years, despite losing the general election to the Conservative Party on the same day.
The 2004 Fareham Council election took place on 10 June 2004 to elect members of Fareham Borough Council in Hampshire, England. Half of the council was up for election and the Conservative party stayed in overall control of the council.
The 2004 Walsall Metropolitan Borough Council election took place on 10 June 2004 to elect members of Walsall Metropolitan Borough Council in the West Midlands, England. The whole council was up for election with boundary changes since the last election in 2003. The Conservative party gained overall control of the council from no overall control.
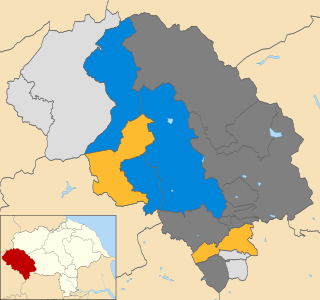
The 2006 Craven District Council election took place on 4 May 2006 to elect members of Craven District Council in North Yorkshire, England. One third of the council was up for election and the council stayed under no overall control.
The 2014 Craven District Council election took place on 22 May 2014 to elect members of Craven District Council in North Yorkshire, England. One third of the council was up for election and the Conservative party stayed in overall control of the council.
The 2004 West Oxfordshire District Council election took place on 10 June 2004 to elect members of West Oxfordshire District Council in Oxfordshire, England. One third of the council was up for election and the Conservative party stayed in overall control of the council.
The 2006 West Oxfordshire District Council election took place on 4 May 2006 to elect members of West Oxfordshire District Council in Oxfordshire, England. One third of the council was up for election and the Conservative party stayed in overall control of the council.