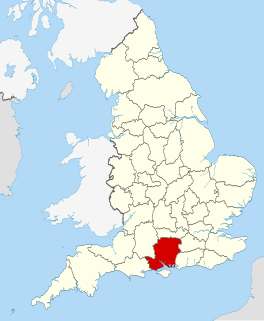
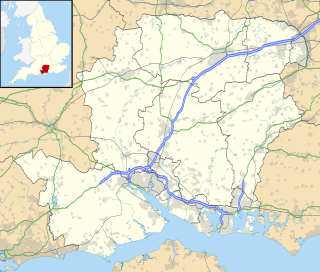
The 2008 Winchester Council election took place on 1 May 2008 to elect members of Winchester District Council in Hampshire, England. One third of the council was up for election and the Conservative party stayed in overall control of the council. [1]
The City of Winchester is a local government district in Hampshire, England, with city status.
Non-metropolitan districts, or colloquially "shire districts", are a type of local government district in England. As created, they are sub-divisions of non-metropolitan counties in a two-tier arrangement.
Hampshire is a county on the southern coast of England. The county town is the city of Winchester. Its two largest cities, Southampton and Portsmouth, are administered separately as unitary authorities; the rest of the county is governed by Hampshire County Council.
After the election, the composition of the council was
The Conservative Party, officially the Conservative and Unionist Party, is a centre-right political party in the United Kingdom. The governing party since 2010, it is the largest in the House of Commons, with 313 Members of Parliament, and also has 249 members of the House of Lords, 18 members of the European Parliament, 31 Members of the Scottish Parliament, 12 members of the Welsh Assembly, eight members of the London Assembly and 8,916 local councillors.
The Liberal Democrats are a centrist, liberal political party in the United Kingdom. It is currently led by Vince Cable. It has 11 Members of Parliament in the House of Commons, 96 members of the House of Lords, one member of the European Parliament, five Members of the Scottish Parliament and one member in the Welsh Assembly and London Assembly. At the height of its influence, the party served as junior partners in a coalition government with the Conservative Party from 2010 to 2015.
The Labour Party is a centre-left political party in the United Kingdom that has been described as an alliance of social democrats, democratic socialists and trade unionists. The party's platform emphasises greater state intervention, social justice and strengthening workers' rights.
One third of the seats were being contested with the Conservatives, Liberal Democrats and Labour each contesting all 19 seats. [3] The Conservatives, who ran the council since the 2006 election were defending 6 seats compared to 11 for the Liberal Democrats and 2 independents. [4] Among the councillors who were defending seats were the Conservative council leader, George Beckett, and the Liberal Democrat group leader Therese Evans. [3] Other candidates included 2 independents, 7 from the United Kingdom Independence Party and 4 from the Green Party. [3]
A Councillor is a member of a local government council.
The Green Party of England and Wales is a green, left-wing political party in England and Wales. Headquartered in London, since September 2018, its co-leaders are Siân Berry and Jonathan Bartley. The Green Party has one representative in the House of Commons, one in the House of Lords, and three in the European Parliament. In addition, it has various councillors in UK local government and two members of the London Assembly.
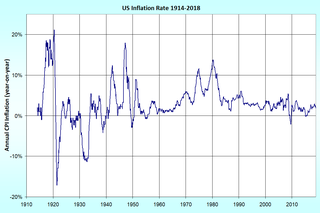
The Conservatives defended their record of running the council saying that they had improved services while keeping council tax rises below the rate of inflation. [4] Meanwhile, the Liberal Democrats criticised the Conservatives over housing and development in the council area. [4]
In economics, inflation is a sustained increase in the general price level of goods and services in an economy over a period of time. When the general price level rises, each unit of currency buys fewer goods and services; consequently, inflation reflects a reduction in the purchasing power per unit of money – a loss of real value in the medium of exchange and unit of account within the economy. The measure of inflation is the inflation rate, the annualized percentage change in a general price index, usually the consumer price index, over time. The opposite of inflation is deflation.
During the campaign a Conservative activist in Whiteley ward, John Hall, was charged after a police investigation over electoral fraud offences. [5]
Whiteley is a community in the county of Hampshire, England, near Fareham. The development straddles the boundary between two council districts: the Borough of Fareham to the south and east, and the city of Winchester to the north and west.
The results saw the Conservatives just maintain their one-seat majority after losing two seats to the Liberal Democrats in St Barnabas and Whiteley wards, but gaining one seat back in St Michael and taking one seat from an independent in Shedfield. [6]
Shedfield is a village and civil parish in the City of Winchester district of Hampshire, England. In the 2001 UK Census, Shedfield had a population of 3,914, falling to 3,842 at the 2011 Census. Shedfield parish includes the neighbouring villages of Waltham Chase and Shirrell Heath.
Party | Seats | Gains | Losses | Net gain/loss | Seats % | Votes % | Votes | +/− | |
---|---|---|---|---|---|---|---|---|---|
Liberal Democrat | 12 | 2 | 1 | +1 | 63.2 | 46.0 | 15,511 | +6.2% | |
Conservative | 6 | 2 | 2 | 0 | 31.6 | 43.3 | 14,609 | -7.0% | |
Independent | 1 | 0 | 1 | -1 | 5.3 | 3.6 | 1,225 | +0.3% | |
Labour | 0 | 0 | 0 | 0 | 0 | 4.4 | 1,492 | +0.0% | |
Green | 0 | 0 | 0 | 0 | 0 | 1.4 | 456 | +0.8% | |
UKIP | 0 | 0 | 0 | 0 | 0 | 1.3 | 451 | -0.2% |
Party | Candidate | Votes | % | ± | |
---|---|---|---|---|---|
Independent | Jean Hammerton | 832 | 38.9 | -7.7 | |
Conservative | Michael North | 650 | 30.4 | -6.7 | |
Liberal Democrat | Brandy Blunt | 553 | 25.9 | +13.7 | |
UKIP | William McNally | 57 | 2.7 | +2.7 | |
Labour | David Picton-Jones | 47 | 2.2 | -1.8 | |
Majority | 182 | 8.5 | -1.0 | ||
Turnout | 2,139 | 41.1 | |||
Independent hold | Swing |
Party | Candidate | Votes | % | ± | |
---|---|---|---|---|---|
Conservative | John Cooper | 294 | 50.4 | +0.3 | |
Liberal Democrat | Steve Nicholls | 273 | 46.8 | +7.3 | |
Labour | James Ross | 16 | 2.7 | -1.2 | |
Majority | 21 | 3.6 | -7.0 | ||
Turnout | 583 | 58.4 | -0.3 | ||
Conservative hold | Swing |
Party | Candidate | Votes | % | ± | |
---|---|---|---|---|---|
Liberal Democrat | Peter Mason | 1,118 | 53.0 | -6.0 | |
Conservative | Sue Evershed | 942 | 44.6 | +6.0 | |
Labour | Timothy Curran | 51 | 2.4 | +0.0 | |
Majority | 176 | 8.4 | -12.0 | ||
Turnout | 2,111 | 50.7 | |||
Liberal Democrat hold | Swing |
Party | Candidate | Votes | % | ± | |
---|---|---|---|---|---|
Conservative | George Beckett | 954 | 51.7 | +7.6 | |
Liberal Democrat | Suzanne Hudson | 820 | 44.4 | -6.0 | |
UKIP | Christopher Barton-Briddon | 48 | 2.6 | -2.0 | |
Labour | Clare McKenna | 23 | 1.2 | +0.3 | |
Majority | 134 | 7.3 | |||
Turnout | 1,845 | 57.7 | |||
Conservative hold | Swing |
Party | Candidate | Votes | % | ± | |
---|---|---|---|---|---|
Conservative | Michael Read | 1,611 | 78.1 | -2.4 | |
Liberal Democrat | Anne Stoneham | 379 | 18.4 | -1.1 | |
Labour | Michael Chaplin | 73 | 3.5 | +3.5 | |
Majority | 1,232 | 59.7 | -1.3 | ||
Turnout | 2,063 | 39.7 | |||
Conservative hold | Swing |
Party | Candidate | Votes | % | ± | |
---|---|---|---|---|---|
Liberal Democrat | Robert Johnston | 938 | 53.8 | +9.3 | |
Conservative | John White | 747 | 42.9 | -8.1 | |
Labour | Elaine Fullaway | 58 | 3.3 | -1.2 | |
Majority | 191 | 10.9 | |||
Turnout | 1,743 | 51.7 | |||
Liberal Democrat hold | Swing |
Party | Candidate | Votes | % | ± | |
---|---|---|---|---|---|
Liberal Democrat | Jacey Jackson | 970 | 59.9 | +2.1 | |
Conservative | Patrick Cunningham | 627 | 38.7 | -1.7 | |
Labour | Brian Fullaway | 23 | 1.4 | -0.4 | |
Majority | 343 | 21.2 | +3.8 | ||
Turnout | 1,620 | 57.7 | |||
Liberal Democrat hold | Swing |
Party | Candidate | Votes | % | ± | |
---|---|---|---|---|---|
Liberal Democrat | David Spender | 1,251 | 68.0 | +19.3 | |
Conservative | Sally Owen | 497 | 27.0 | -21.2 | |
Green | Jim Kirkpatrick | 59 | 3.2 | +3.2 | |
Labour | John Elliot-Smith | 34 | 1.8 | -1.3 | |
Majority | 754 | 41.0 | +40.5 | ||
Turnout | 1,841 | 56.9 | |||
Liberal Democrat hold | Swing |
Party | Candidate | Votes | % | ± | |
---|---|---|---|---|---|
Conservative | Linda Gemmell | 695 | 50.1 | +5.6 | |
Independent | Stuart Jones | 393 | 28.3 | -9.7 | |
Liberal Democrat | Michael Toole | 170 | 12.2 | +12.2 | |
Labour | Patricia Hayward | 66 | 4.8 | -0.8 | |
UKIP | Douglas Reed | 64 | 4.6 | +4.6 | |
Majority | 302 | 21.8 | +15.3 | ||
Turnout | 1,388 | 44.7 | |||
Conservative gain from Independent | Swing | ||||
Party | Candidate | Votes | % | ± | |
---|---|---|---|---|---|
Liberal Democrat | Allan Mitchell | 1,401 | 53.3 | +10.2 | |
Conservative | Anne Saunders | 1,157 | 44.0 | -5.6 | |
Labour | Adrian Field | 72 | 2.7 | -0.2 | |
Majority | 244 | 9.3 | |||
Turnout | 2,630 | 55.2 | |||
Liberal Democrat gain from Conservative | Swing | ||||
Party | Candidate | Votes | % | ± | |
---|---|---|---|---|---|
Liberal Democrat | Jim Maynard | 1,085 | 51.7 | -2.7 | |
Conservative | Miff Kayum | 711 | 33.9 | -3.6 | |
Green | Jo Woodman | 163 | 7.8 | +7.8 | |
Labour | Denis Archdeacon | 98 | 4.7 | +0.3 | |
UKIP | Lawrence Hole | 42 | 2.0 | +2.0 | |
Majority | 374 | 17.8 | +0.9 | ||
Turnout | 2,099 | 43.8 | |||
Liberal Democrat hold | Swing |
Party | Candidate | Votes | % | ± | |
---|---|---|---|---|---|
Liberal Democrat | John Higgins | 611 | 39.8 | -3.5 | |
Labour | Antony De Peyer | 458 | 29.8 | +4.5 | |
Conservative | Ann Jones | 390 | 25.4 | -2.5 | |
UKIP | Geoffrey Barrett | 78 | 5.1 | +1.6 | |
Majority | 153 | 10.0 | -5.4 | ||
Turnout | 1,537 | 32.9 | |||
Liberal Democrat hold | Swing |
Party | Candidate | Votes | % | ± | |
---|---|---|---|---|---|
Liberal Democrat | Lucille Thompson | 792 | 52.4 | -0.7 | |
Conservative | Rob Ducker | 542 | 35.8 | +2.6 | |
Labour | Patrick Davies | 178 | 11.8 | +2.6 | |
Majority | 250 | 16.6 | -3.3 | ||
Turnout | 1,512 | 36.0 | |||
Liberal Democrat hold | Swing |
Party | Candidate | Votes | % | ± | |
---|---|---|---|---|---|
Conservative | Robert Sanders | 1,166 | 51.6 | -7.1 | |
Liberal Democrat | Lynda Banister | 900 | 39.8 | +6.4 | |
Green | Alison Craig | 99 | 4.4 | +4.4 | |
Labour | Albert Edwards | 63 | 2.8 | -2.0 | |
UKIP | David Abbott | 33 | 1.5 | -1.6 | |
Majority | 266 | 11.8 | -13.5 | ||
Turnout | 2,261 | 48.2 | |||
Conservative gain from Liberal Democrat | Swing | ||||
Party | Candidate | Votes | % | ± | |
---|---|---|---|---|---|
Liberal Democrat | Ray Love | 953 | 57.7 | -1.2 | |
Conservative | Kathleen Jeffreys | 489 | 29.6 | -7.2 | |
Green | Bridget Leyden | 135 | 8.2 | +8.2 | |
Labour | Tessa Valentine | 74 | 4.5 | +0.2 | |
Majority | 464 | 28.1 | +6.0 | ||
Turnout | 1,651 | 36.5 | |||
Liberal Democrat hold | Swing |
Party | Candidate | Votes | % | ± | |
---|---|---|---|---|---|
Liberal Democrat | Simon Cook | 1,505 | 57.8 | +28.0 | |
Conservative | Barbara Jeffs | 923 | 35.5 | -19.2 | |
UKIP | David Samuel | 129 | 5.0 | -3.7 | |
Labour | Robin Atkins | 45 | 1.7 | -5.0 | |
Majority | 582 | 22.3 | |||
Turnout | 2,602 | 53.5 | |||
Liberal Democrat hold | Swing |
Party | Candidate | Votes | % | ± | |
---|---|---|---|---|---|
Liberal Democrat | Vivian Achwal | 551 | 53.5 | +6.0 | |
Conservative | Mark Wheeler | 459 | 44.6 | -4.9 | |
Labour | Barry Jones | 20 | 1.9 | -1.1 | |
Majority | 92 | 8.9 | |||
Turnout | 1,030 | 45.2 | |||
Liberal Democrat gain from Conservative | Swing | ||||
Party | Candidate | Votes | % | ± | |
---|---|---|---|---|---|
Liberal Democrat | Therese Evans | 857 | 64.8 | +3.7 | |
Conservative | Karen Jeffreys | 442 | 33.4 | -3.2 | |
Labour | Andrew Rudge | 23 | 1.7 | -0.6 | |
Majority | 415 | 31.4 | +6.9 | ||
Turnout | 1,322 | 43.2 | |||
Liberal Democrat hold | Swing |
Party | Candidate | Votes | % | ± | |
---|---|---|---|---|---|
Conservative | Barry Lipscomb | 1,313 | 74.3 | +11.0 | |
Liberal Democrat | Simon Hobson | 384 | 21.7 | -5.6 | |
Labour | Nigel Lickley | 70 | 4.0 | +0.1 | |
Majority | 929 | 52.6 | +16.6 | ||
Turnout | 1,767 | 42.3 | |||
Conservative hold | Swing |
The 2008 Harlow District Council election took place on 1 May 2008 to elect members of Harlow District Council in Essex, England. One third of the council was up for election and the Conservative party gained overall control of the council from no overall control.
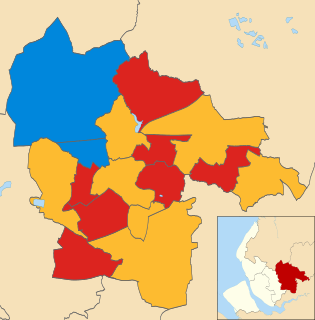
The 2007 St Helens Metropolitan Borough Council election took place on 3 May 2007 to elect members of St Helens Metropolitan Borough Council in Merseyside, England. One third of the council was up for election and the council stayed under no overall control.
The 2008 Tandridge District Council election took place on 1 May 2008 to elect members of Tandridge District Council in Surrey, England. One third of the council was up for election and the Conservative party stayed in overall control of the council.
The 2007 St Albans City and District Council election took place on 3 May 2007 to elect members of St Albans District Council in Hertfordshire, England. One third of the council was up for election and the Liberal Democrats lost overall control of the council to no overall control.
The 2002 Wakefield Metropolitan District Council election took place on 2 May 2002 to elect members of Wakefield Metropolitan District Council in West Yorkshire, England. One third of the council was up for election and the Labour party kept overall control of the council.
The 2010 Winchester Council election took place on 6 May 2010 to elect members of Winchester District Council in Hampshire, England. One third of the council was up for election and the Liberal Democrats gained overall control of the council from the Conservative party.
The 2000 Winchester Council election took place on 4 May 2000 to elect members of Winchester District Council in Hampshire, England. One third of the council was up for election and the Liberal Democrats stayed in overall control of the council.
The 2003 Winchester Council election took place on 1 May 2003 to elect members of Winchester District Council in Hampshire, England. One third of the council was up for election and the Liberal Democrats stayed in overall control of the council.
The 2004 Winchester Council election took place on 10 June 2004 to elect members of Winchester District Council in Hampshire, England. One third of the council was up for election and the Liberal Democrats lost overall control of the council to no overall control.
The 2006 Winchester Council election took place on 4 May 2006 to elect members of Winchester District Council in Hampshire, England. One third of the council was up for election and the Conservative party gained overall control of the council from no overall control.
The 2007 Winchester Council election took place on 3 May 2007 to elect members of Winchester District Council in Hampshire, England. One third of the council was up for election and the Conservative party stayed in overall control of the council.
The 2003 Hart Council election took place on 1 May 2003 to elect members of Hart District Council in Hampshire, England. One third of the council was up for election and the Conservative party stayed in overall control of the council.
The 2002 Rushmoor Council election took place on 2 May 2002 to elect members of Rushmoor Borough Council in Hampshire, England. The whole council was up for election with boundary changes since the last election in 2000 reducing the number of seats by 3. The Conservative party stayed in overall control of the council.
The 2004 Pendle Borough Council election took place on 10 June 2004 to elect members of Pendle Borough Council in Lancashire, England. One third of the council was up for election and the Liberal Democrats gained overall control of the council from no overall control.
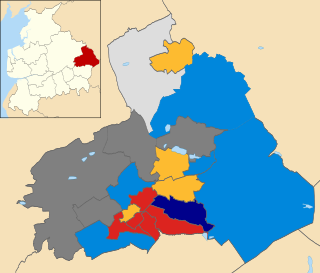
The 2008 Pendle Borough Council election took place on 1 May 2008 to elect members of Pendle Borough Council in Lancashire, England. One third of the council was up for election and the Liberal Democrats lost overall control of the council to no overall control.
The 2008 Sandwell Metropolitan Borough Council election took place on 1 May 2008 to elect members of Sandwell Metropolitan Borough Council in the West Midlands, England. One third of the council was up for election and the Labour party stayed in overall control of the council.
The 2011 Sandwell Metropolitan Borough Council election took place on 5 May 2011 to elect members of Sandwell Metropolitan Borough Council in the West Midlands, England. One third of the council was up for election and the Labour party stayed in overall control of the council.
The 2012 Pendle Borough Council election took place on 3 May 2012 to elect members of Pendle Borough Council in Lancashire, England. One third of the council was up for election and the council stayed under no overall control.
The 2018 Sunderland City Council election took place on 3 May 2018 to elect members of Sunderland City Council in England. The election took place on the same day as other local elections.
Elections to Winchester City Council took place on Thursday 2 May 2019, alongside other local elections across the country. The Conservatives party held a narrow majority of one at the last election, with the seats contested in this election were last contested in 2016 the Conservatives defended 10 seats, whilst the Liberal Democrats defended 4. Town and parish councils in the city boundary were also up for election.
Preceded by Winchester Council election, 2007 | Winchester local elections | Succeeded by Winchester Council election, 2010 |