The 2010 Winchester Council election took place on 6 May 2010 to elect members of Winchester District Council in Hampshire, England. One third of the council was up for election and the Liberal Democrats gained overall control of the council from the Conservative party. [1]
The City of Winchester is a local government district in Hampshire, England, with city status.
Non-metropolitan districts, or colloquially "shire districts", are a type of local government district in England. As created, they are sub-divisions of non-metropolitan counties in a two-tier arrangement.
Hampshire is a county on the southern coast of England. The county town is the city of Winchester. Its two largest cities, Southampton and Portsmouth, are administered separately as unitary authorities; the rest of the county is governed by Hampshire County Council.
After the election, the composition of the council was
The Liberal Democrats are a centrist, liberal political party in the United Kingdom. It is currently led by Vince Cable. It has 11 Members of Parliament in the House of Commons, 96 members of the House of Lords, one member of the European Parliament, five Members of the Scottish Parliament and one member in the Welsh Assembly and London Assembly. At the height of its influence, the party served as junior partners in a coalition government with the Conservative Party from 2010 to 2015.
The Conservative Party, officially the Conservative and Unionist Party, is a centre-right political party in the United Kingdom. The governing party since 2010, it is the largest in the House of Commons, with 313 Members of Parliament, and also has 249 members of the House of Lords, 18 members of the European Parliament, 31 Members of the Scottish Parliament, 12 members of the Welsh Assembly, eight members of the London Assembly and 8,916 local councillors.
The Conservatives had gained control of Winchester council in the 2006 election after a sex scandal involving the local Liberal Democrat MP Mark Oaten. [4] Going into the 2010 election the Conservatives had a majority of just 1 seat [3] and were defending 13 seats compared to 4 for the Liberal Democrats, due to the seats they won in 2006 being due for election in 2010. [4] Several councillors stood down at the election, including George Hollingbery from The Alresfords ward to contest the Meon Valley constituency in the general election, Fred Allgood from Denmead ward, Georgina Busher from Bishop's Waltham and James Stephens from St Luke ward. [5] Brian Collin also did not defend his Olivers Battery and Badger Farm ward, which he had held for 24 years, to contest St John and All Saints instead. [5]
Mark Oaten is a British politician who was a senior member of the Liberal Democrats. He served as the Member of Parliament for Winchester from 1997-2010.
A Councillor is a member of a local government council.
George Michael Edward Hollingbery is a British Conservative Party politician who was first elected at the 2010 general election as the Member of Parliament (MP) for Meon Valley, a new Hampshire constituency created as a result of boundary changes.
The Conservatives defended their record on the council pointing to a repaving of the high street, park and ride projects and keeping council tax increases below inflation. [6] However the Liberal Democrats accused the Conservatives of running down reserves that the Liberal Democrats had built up when they were in power and were confident of taking control in particular with the election taking place at the same time as the general election. [6] The Labour party were defending their last seat on the council in St John and All Saints ward with predictions that Labour could be without representation on the council for the first time. [6] Meanwhile, the Green party only contested one seat in St Bartholomew in order to concentrate their efforts and campaigned on development issues. [6]
Park and ride facilities are parking lots with public transport connections that allow commuters and other people heading to city centres to leave their vehicles and transfer to a bus, rail system, or carpool for the remainder of the journey. The vehicle is left in the parking lot during the day and retrieved when the owner returns. Park and rides are generally located in the suburbs of metropolitan areas or on the outer edges of large cities. A park and ride that only offers parking for meeting a carpool and not connections to public transport may be called a park and pool.
In economics, inflation is a sustained increase in the general price level of goods and services in an economy over a period of time. When the general price level rises, each unit of currency buys fewer goods and services; consequently, inflation reflects a reduction in the purchasing power per unit of money – a loss of real value in the medium of exchange and unit of account within the economy. The measure of inflation is the inflation rate, the annualized percentage change in a general price index, usually the consumer price index, over time. The opposite of inflation is deflation.
The Labour Party is a centre-left political party in the United Kingdom that has been described as an alliance of social democrats, democratic socialists and trade unionists. The party's platform emphasises greater state intervention, social justice and strengthening workers' rights.
The results saw the Liberal Democrats take control over the council after gaining 5 seats to hold 29 of the 57 seats. [7] This gave them an overall majority of 1 seat, despite the Conservatives winning 10 seats at the election compared to 9 for the Liberal Democrats. [7] [3] The Conservatives did make one gain, taking a former independent seat where the councillor Georgina Busher stood down at the election. [8] Meanwhile, the last remaining Labour seat was lost after Labour was defeated in St John and All Saints ward. [7]
Party | Seats | Gains | Losses | Net gain/loss | Seats % | Votes % | Votes | +/− | |
---|---|---|---|---|---|---|---|---|---|
Conservative | 10 | 1 | 4 | -3 | 52.6 | 46.4 | 25,681 | +3.1% | |
Liberal Democrat | 9 | 5 | 0 | +5 | 47.4 | 44.6 | 24,676 | -1.4% | |
Labour | 0 | 0 | 1 | -1 | 0 | 6.7 | 3,721 | +2.3% | |
Independent | 0 | 0 | 1 | -1 | 0 | 1.4 | 779 | -2.2% | |
Green | 0 | 0 | 0 | 0 | 0 | 0.8 | 443 | -0.6% | |
Party | Candidate | Votes | % | ± | |
---|---|---|---|---|---|
Conservative | David Mclean | 1,552 | 38.5 | +8.1 | |
Liberal Democrat | Benjamin Stoneham | 1,479 | 36.7 | +10.8 | |
Independent | Gideon Lake | 779 | 19.3 | -19.6 | |
Labour | Steve Haines | 224 | 5.6 | +3.4 | |
Majority | 73 | 1.8 | |||
Turnout | 4,034 | 75.4 | +34.3 | ||
Conservative gain from Independent | Swing | ||||
Party | Candidate | Votes | % | ± | |
---|---|---|---|---|---|
Conservative | Harry Verney | 866 | 60.9 | -1.7 | |
Liberal Democrat | Christopher Day | 503 | 35.4 | -2.0 | |
Labour | Timothy Curran | 52 | 3.7 | +3.7 | |
Majority | 363 | 25.5 | +0.3 | ||
Turnout | 1,421 | 80.1 | +27.1 | ||
Conservative hold | Swing | ||||
Party | Candidate | Votes | % | ± | |
---|---|---|---|---|---|
Liberal Democrat | Richard Izard | 1,904 | 57.0 | +4.0 | |
Conservative | Nigel Burwood | 1,285 | 38.5 | -6.1 | |
Labour | Nicholas Carr | 153 | 4.6 | +2.2 | |
Majority | 619 | 18.5 | +10.1 | ||
Turnout | 3,342 | 77.7 | +27.0 | ||
Liberal Democrat hold | Swing | ||||
Party | Candidate | Votes | % | ± | |
---|---|---|---|---|---|
Conservative | Kirk Phillips | 2,535 | 65.1 | -13.0 | |
Liberal Democrat | Margaret Scriven | 1,142 | 29.3 | +10.9 | |
Labour | David Picton-Jones | 219 | 5.6 | +2.1 | |
Majority | 1,393 | 35.8 | -23.9 | ||
Turnout | 3,896 | 74.4 | +34.7 | ||
Conservative hold | Swing | ||||
Party | Candidate | Votes | % | ± | |
---|---|---|---|---|---|
Conservative | Tony Coates | 910 | 66.4 | -12.1 | |
Liberal Democrat | Alan Hibbert | 419 | 30.6 | +9.1 | |
Labour | Alyn Edwards | 41 | 3.0 | +3.0 | |
Majority | 491 | 35.8 | -11.2 | ||
Turnout | 1,370 | 80.8 | +21.8 | ||
Conservative hold | Swing | ||||
Party | Candidate | Votes | % | ± | |
---|---|---|---|---|---|
Liberal Democrat | Jane Rutter | 1,393 | 52.6 | -1.2 | |
Conservative | Stanley Howell | 1,098 | 41.4 | -1.5 | |
Labour | Elaine Fullaway | 158 | 6.0 | +2.7 | |
Majority | 295 | 11.1 | +0.2 | ||
Turnout | 2,649 | 77.8 | +26.1 | ||
Liberal Democrat gain from Conservative | Swing | ||||
Party | Candidate | Votes | % | ± | |
---|---|---|---|---|---|
Liberal Democrat | Lynda Banister | 1,615 | 60.2 | -7.8 | |
Conservative | Kim Gottlieb | 943 | 35.1 | +8.1 | |
Labour | Margaret Rees | 126 | 4.7 | +2.9 | |
Majority | 672 | 25.0 | -16.0 | ||
Turnout | 2,684 | 82.4 | +25.5 | ||
Liberal Democrat hold | Swing | ||||
Party | Candidate | Votes | % | ± | |
---|---|---|---|---|---|
Conservative | Laurence Ruffell | 1,330 | 55.2 | -6.7 | |
Liberal Democrat | Jo White | 983 | 40.8 | +5.6 | |
Labour | Clive Coldwell | 96 | 4.0 | +1.0 | |
Majority | 347 | 14.4 | -12.3 | ||
Turnout | 2,409 | 78.7 | +31.7 | ||
Conservative hold | Swing | ||||
Party | Candidate | Votes | % | ± | |
---|---|---|---|---|---|
Liberal Democrat | Susan Witt | 1,798 | 49.3 | -4.0 | |
Conservative | Richard Worrall | 1,618 | 44.3 | +0.3 | |
Labour | Tania Ziegler | 234 | 6.4 | +3.7 | |
Majority | 180 | 4.9 | -4.4 | ||
Turnout | 3,650 | 76.5 | +21.3 | ||
Liberal Democrat gain from Conservative | Swing | ||||
Party | Candidate | Votes | % | ± | |
---|---|---|---|---|---|
Liberal Democrat | Dominic Hiscock | 1,802 | 50.6 | -1.1 | |
Conservative | Paul Wing | 1,114 | 31.3 | -2.6 | |
Green | Alison Craig | 443 | 12.4 | +4.6 | |
Labour | Denis Archdeacon | 205 | 5.8 | +1.1 | |
Majority | 688 | 19.3 | +1.5 | ||
Turnout | 3,564 | ||||
Liberal Democrat hold | Swing | ||||
Party | Candidate | Votes | % | ± | |
---|---|---|---|---|---|
Liberal Democrat | Brian Collin | 1,217 | 41.2 | +1.4 | |
Labour | Chris Pines | 993 | 33.6 | +3.8 | |
Conservative | James Byrnes | 743 | 25.2 | -0.2 | |
Majority | 224 | 7.6 | -2.4 | ||
Turnout | 2,953 | 63.2 | +30.3 | ||
Liberal Democrat gain from Labour | Swing | ||||
Party | Candidate | Votes | % | ± | |
---|---|---|---|---|---|
Liberal Democrat | Rose Prowse | 1,397 | 52.1 | -0.3 | |
Conservative | Jamie Scott | 1,038 | 38.7 | +2.9 | |
Labour | Peter Rees | 247 | 9.2 | -2.6 | |
Majority | 359 | 13.4 | -3.2 | ||
Turnout | 2,682 | 63.7 | +27.7 | ||
Liberal Democrat gain from Conservative | Swing | ||||
Party | Candidate | Votes | % | ± | |
---|---|---|---|---|---|
Conservative | Ian Tait | 1,799 | 50.4 | -1.2 | |
Liberal Democrat | Tony Ayres | 1,582 | 44.4 | +4.6 | |
Labour | Antony De Peyer | 185 | 5.2 | +2.4 | |
Majority | 217 | 6.1 | -5.7 | ||
Turnout | 3,566 | 75.2 | +27.0 | ||
Conservative hold | Swing | ||||
Party | Candidate | Votes | % | ± | |
---|---|---|---|---|---|
Liberal Democrat | Ray Pearce | 2,021 | 57.9 | +0.2 | |
Conservative | Helen Osborne | 1,240 | 35.5 | +5.9 | |
Labour | Adrian Field | 230 | 6.6 | +2.1 | |
Majority | 781 | 22.4 | -5.7 | ||
Turnout | 3,491 | 74.1 | +37.6 | ||
Liberal Democrat hold | Swing | ||||
Party | Candidate | Votes | % | ± | |
---|---|---|---|---|---|
Conservative | Roger Huxstep | 1,497 | 63.4 | +13.3 | |
Liberal Democrat | Michael Toole | 743 | 31.5 | +19.3 | |
Labour | Pat Hayward | 122 | 5.2 | +0.4 | |
Majority | 754 | 31.9 | +10.1 | ||
Turnout | 2,362 | 67.0 | +22.3 | ||
Conservative hold | Swing | ||||
Party | Candidate | Votes | % | ± | |
---|---|---|---|---|---|
Conservative | Keith Wood | 668 | 60.9 | -1.1 | |
Liberal Democrat | Victoria Kilroy | 397 | 36.2 | -1.8 | |
Labour | Tessa Valentine | 32 | 2.9 | +2.9 | |
Majority | 271 | 24.7 | +0.7 | ||
Turnout | 1,097 | 71.6 | +19.6 | ||
Conservative hold | Swing | ||||
Party | Candidate | Votes | % | ± | |
---|---|---|---|---|---|
Conservative | Vicki Weston | 1,549 | 57.6 | -19.0 | |
Liberal Democrat | Sheila Campbell | 1,024 | 38.1 | +14.7 | |
Labour | Robert Rudge | 115 | 4.3 | +4.3 | |
Majority | 525 | 19.5 | -33.7 | ||
Turnout | 2,688 | 80.5 | +31.5 | ||
Conservative hold | Swing | ||||
Party | Candidate | Votes | % | ± | |
---|---|---|---|---|---|
Liberal Democrat | Margot Power | 1,972 | 48.9 | -8.9 | |
Conservative | Ken Yeldham | 1,906 | 47.2 | +11.7 | |
Labour | Robin Atkins | 156 | 3.9 | +2.2 | |
Majority | 66 | 1.6 | -20.7 | ||
Turnout | 4,034 | 79.7 | +26.2 | ||
Liberal Democrat gain from Conservative | Swing | ||||
Party | Candidate | Votes | % | ± | |
---|---|---|---|---|---|
Conservative | Stephen Godfrey | 1,990 | 58.4 | -15.9 | |
Liberal Democrat | Richard Coleman | 1,285 | 37.7 | +16.0 | |
Labour | Andrew Adams | 133 | 3.9 | -0.1 | |
Majority | 705 | 20.7 | -31.9 | ||
Turnout | 3,408 | 78.8 | +36.5 | ||
Conservative hold | Swing | ||||
The 2003 Harlow District Council election took place on 1 May 2003 to elect members of Harlow District Council in Essex, England. One third of the council was up for election and the council stayed under no overall control.
The 2008 Tandridge District Council election took place on 1 May 2008 to elect members of Tandridge District Council in Surrey, England. One third of the council was up for election and the Conservative party stayed in overall control of the council.
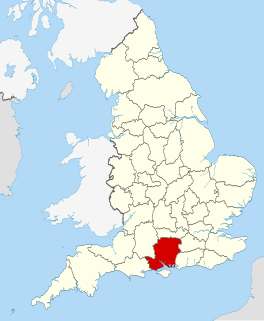
The 2000 Winchester Council election took place on 4 May 2000 to elect members of Winchester District Council in Hampshire, England. One third of the council was up for election and the Liberal Democrats stayed in overall control of the council.
The 2003 Winchester Council election took place on 1 May 2003 to elect members of Winchester District Council in Hampshire, England. One third of the council was up for election and the Liberal Democrats stayed in overall control of the council.
The 2004 Winchester Council election took place on 10 June 2004 to elect members of Winchester District Council in Hampshire, England. One third of the council was up for election and the Liberal Democrats lost overall control of the council to no overall control.
The 2006 Winchester Council election took place on 4 May 2006 to elect members of Winchester District Council in Hampshire, England. One third of the council was up for election and the Conservative party gained overall control of the council from no overall control.
The 2007 Winchester Council election took place on 3 May 2007 to elect members of Winchester District Council in Hampshire, England. One third of the council was up for election and the Conservative party stayed in overall control of the council.
The 2008 Winchester Council election took place on 1 May 2008 to elect members of Winchester District Council in Hampshire, England. One third of the council was up for election and the Conservative party stayed in overall control of the council.
The 2004 South Tyneside Metropolitan Borough Council election took place on 10 June 2004 to elect members of South Tyneside Metropolitan Borough Council in Tyne and Wear, England. The whole council was up for election with boundary changes since the last election in 2003 reducing the number of seats by 6. The Labour party stayed in overall control of the council.
The 2008 Rushmoor Council election took place on 1 May 2008 to elect members of Rushmoor Borough Council in Hampshire, England. One third of the council was up for election and the Conservative party stayed in overall control of the council.
The 2008 Cheltenham Council election took place on 1 May 2008 to elect members of Cheltenham Borough Council in Gloucestershire, England. Half of the council was up for election and the council stayed under no overall control.
The 2006 Sunderland Council election took place on 4 May 2006 to elect members of Sunderland City Council in Tyne and Wear, England. One third of the Council was up for election and the Labour party stayed in overall control.
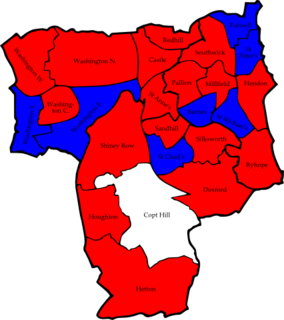
The 2007 Sunderland Council election took place on 3 May 2007 to elect members of Sunderland Metropolitan Borough Council in Tyne and Wear, England. One third of the council was up for election and the Labour party stayed in overall control of the council.
The 2008 Sunderland Council election took place on 1 May 2008 to elect members of Sunderland Metropolitan Borough Council in Tyne and Wear, England. One third of the council was up for election and the Labour party stayed in overall control of the council.
The 2010 Sunderland Council election took place on 6 May 2010 to elect members of Sunderland Metropolitan Borough Council in Tyne and Wear, England. One third of the council was up for election and the Labour party stayed in overall control of the council. The election took place on the same day as the 2010 General Election.
The 2011 Sandwell Metropolitan Borough Council election took place on 5 May 2011 to elect members of Sandwell Metropolitan Borough Council in the West Midlands, England. One third of the council was up for election and the Labour party stayed in overall control of the council.
The 2012 Huntingdonshire District Council election took place on 3 May 2012 to elect members of Huntingdonshire District Council in Cambridgeshire, England. One third of the council was up for election and the Conservative party stayed in overall control of the council.
The 2011 Harlow District Council election took place on 5 May 2011 to elect members of Harlow District Council in Essex, England. One third of the council was up for election and the Conservative party stayed in overall control of the council.
The 2010 St Helens Metropolitan Borough Council election took place on 6 May 2010 to elect members of St Helens Metropolitan Borough Council in Merseyside, England. One third of the council was up for election and the Labour party gained overall control of the council from no overall control.
Elections to Winchester City Council took place on Thursday 2 May 2019, alongside other local elections across the country. The Conservatives party held a narrow majority of one at the last election, with the seats contested in this election were last contested in 2016 the Conservatives defended 10 seats, whilst the Liberal Democrats defended 4. Town and parish councils in the city boundary were also up for election.
Preceded by Winchester Council election, 2008 | Winchester local elections | Succeeded by Winchester Council election, 2011 |