Talukas of Gujarat | |
---|---|
Category | Talukas |
Location | Gujarat |
Number | 252 Talukas [1] |
Government |
Gujarat has 252 talukas(tehsils,sub-districts). [2]
The urban status is listed for the headquarters town of the taluka, rural talukas are much larger. Urban status follows the census standard.
The table below lists all the talukas in the state of Gujarat, India, by district. [3] [4] [5] [6]
Taluka Name [8] | Population | Area (in sq km) | Number of Villages | Number of Gram Panchayat | Literacy Rate | Map | |
---|---|---|---|---|---|---|---|
2011 | 1991 | ||||||
Ahmedabad City | 5,570,585 | 464.16 | 89.62% | ||||
Bavla | 124000 | 90408 | 414.80 | 48 | 48 | 77.12% | |
Daskroi | 233925 | 175080 | 357.44 | 64 | 63 | 80.01% | |
Detroj-Rampura | 76555 | 68734 | 450.00 | 51 | 46 | ||
Dhandhuka | 74960 | 66103 | 46 | 40 | |||
Dholera | 50821 | 9421 | 33 | 34 | |||
Dholka | 166641 | 140113 | 828.58 | 71 | 65 | 72.45% | |
Mandal | 58064 | 49977 | 325.29 | 37 | 36 | 76.20% | |
Sanand | 195005 | 136777 | 443.52 | 67 | 69 | 83.91% | |
Viramgam | 131680 | 93982 | 1,255.72 | 68 | 65 | 71.56% |
This section needs to be updated.(June 2023) |
Taluka Name [9] | Population | Area (in sq km) | Number of Villages | Literacy Rate |
---|---|---|---|---|
Amreli | 398,651 | 2,564.89 | 121 | 76.12% |
Lathi | 145,704 | 1,155.00 | 73 | 68.29% |
Savarkundla | 206,147 | 1,141.20 | 76 | 72.51% |
Babra | 87,156 | 656.70 | 35 | 71.05% |
Bagasara | 110,127 | 679.43 | 47 | 72.08% |
Dhari | 175,251 | 1,202.53 | 87 | 69.76% |
Kunkavav Vadia | 74,738 | 425.50 | 32 | 65.84% |
This section needs to be updated.(June 2023) |
Taluka [10] | Population | Area (sq km) | Literacy Rate (%) |
---|---|---|---|
Anand | 226,026 | 240 | 85.60 |
Petlad | 138,743 | 244 | 84.02 |
Sojitra | 67,305 | 182 | 76.74 |
Tarapur | 80,237 | 163 | 81.73 |
Umreth | 98,747 | 201 | 83.78 |
This section needs to be updated.(June 2023) |
Taluka Name [11] | Population | Area (in sq km) | Number of Villages | Literacy Rate |
---|---|---|---|---|
Modasa | 215,689 | 1,333.23 | 80 | 73.45% |
Malpur | 76,423 | 714.06 | 40 | 65.81% |
Dhansura | 60,841 | 401.81 | 35 | 69.05% |
Bayad | 38,218 | 341.42 | 30 | 64.39% |
This section needs to be updated.(June 2023) |
Taluka Name [12] | Population | Area (in sq km) | Number of Villages | Literacy Rate |
---|---|---|---|---|
Palanpur | 595,891 | 2,922 | 130 | 68.78% |
Deesa | 322,170 | 3,413 | 93 | 70.41% |
Tharad | 224,987 | 2,546 | 81 | 64.93% |
Dhanera | 185,688 | 2,286 | 70 | 66.31% |
Vav | 94,846 | 1,129 | 38 | 56.19% |
Amirgadh | 60,093 | 1,022 | 37 | 60.02% |
Dantiwada | 98,515 | 1,602 | 52 | 64.22% |
Vadgam | 78,142 | 1,339 | 40 | 56.83% |
Bhabhar | 61,404 | 1,254 | 36 | 57.96% |
Kankrej | 48,063 | 788 | 29 | 58.54% |
This section needs to be updated.(June 2023) |
Taluka Name [13] | Population | Area (in sq km) | Number of Villages | Literacy Rate |
---|---|---|---|---|
Bharuch | 335,855 | 293.51 | 52 | 85.46% |
Ankleshwar | 143,373 | 159.63 | 29 | 79.45% |
Jambusar | 225,751 | 731.64 | 78 | 77.33% |
Amod | 102,982 | 329.46 | 45 | 69.85% |
Vagra | 97,087 | 618.64 | 67 | 72.57% |
Hansot | 74,812 | 271.59 | 40 | 68.95% |
This section needs to be updated.(June 2023) |
Taluka Name [14] | Population | Area (in sq km) | Number of Villages | Literacy Rate |
---|---|---|---|---|
Bhavnagar | 1,200,000 | 472.80 | 2 | 78.56% |
Mahuva | 237,262 | 675.94 | 83 | 75.08% |
Talaja | 168,216 | 624.98 | 71 | 72.91% |
Sihor | 183,654 | 500.10 | 76 | 70.62% |
Gariadhar | 97,596 | 342.22 | 52 | 72.38% |
Ghogha | 73,287 | 340.16 | 28 | 75.84% |
Umrala | 81,931 | 412.08 | 41 | 71.62% |
This section needs to be updated.(June 2023) |
Taluka Name [15] | Population | Area (in sq km) | Number of Villages | Literacy Rate |
---|---|---|---|---|
Botad | 290,753 | 394.74 | 53 | 76.21% |
Gadhada | 87,283 | 505.04 | 32 | 63.40% |
Barwala | 71,479 | 295.53 | 25 | 66.88% |
Ranpur | 92,019 | 503.22 | 55 | 67.92% |
This section needs to be updated.(June 2023) |
Taluka Name [16] [17] | Population | Area (in sq km) | Number of Villages | Literacy Rate |
---|---|---|---|---|
Chhota Udaipur | 179,066 | 1,338 | 124 | 66.89% |
Jetpur Pavi | 57,329 | 587 | 46 | 64.76% |
Kawant | 81,239 | 1,575 | 82 | 59.32% |
Bodeli | 95,662 | 702 | 54 | 71.48% |
This section needs to be updated.(June 2023) |
Taluka Name [18] | Population | Area (in sq km) | Number of Villages | Literacy Rate |
---|---|---|---|---|
Dahod | 243,731 | 2,125 | 175 | 70.68% |
Dhanpur | 95,874 | 1,150 | 61 | 67.52% |
Fatepura | 137,438 | 1,358 | 97 | 68.29% |
Garbada | 71,234 | 1,079 | 70 | 65.43% |
Limkheda | 88,919 | 1,313 | 97 | 62.75% |
Sanjeli | 70,144 | 1,123 | 78 | 65.88% |
This section needs to be updated.(June 2023) |
Taluka Name [19] [20] | Population | Area (in sq km) | Number of Villages | Literacy Rate |
---|---|---|---|---|
Ahwa | 81,054 | 504.71 | 44 | 64.52% |
Subir | 37,468 | 344.46 | 23 | 63.16% |
Waghai | 60,980 | 1,023.02 | 58 | 68.31% |
Dang total | 195,296 | 2,072.36 | 139 | 65.88% |
This section needs to be updated.(June 2023) |
Taluka Name [21] | Population | Area (in sq km) | Number of Villages | Literacy Rate |
---|---|---|---|---|
Khambhalia | 191,672 | 885.33 | 90 | 70.85% |
Dwarka | 176,335 | 6,694.25 | 139 | 80.64% |
Bhanvad | 63,247 | 811.80 | 62 | 63.02% |
Kalyanpur | 43,889 | 526.96 | 42 | 59.82% |
Okhamandal | 63,338 | 564.84 | 56 | 68.17% |
Jamnagar Rural | 51,906 | 298.06 | 37 | 77.33% |
This section needs to be updated.(June 2023) |
Taluka [22] | Area (in sq. km) | Population (2011) | Literacy Rate (%) |
---|---|---|---|
Gandhinagar | 490.19 | 1,387,478 | 89.00 |
Kalol | 625.29 | 441,074 | 83.43 |
Mansa | 418.77 | 150,086 | 78.26 |
Dehgam | 282.93 | 148,608 | 81.98 |
Kheralu | 640.42 | 179,283 | 69.23 |
Viramgam | 679.22 | 214,045 | 71.00 |
Dholka | 392.31 | 191,911 | 81.03 |
This section needs to be updated.(June 2023) |
Taluka Name [23] | Population | Area (in sq. km) | Literacy Rate | Major Villages |
---|---|---|---|---|
Veraval | 191,594 | 552 | 82.35% | Somnath, Talala, Kodinar, Sutrapada |
Una | 188,905 | 890 | 76.55% | Una, Delvada, Keshod, Manavadar |
Gir-Gadhada | 119,625 | 1,147 | 72.02% | Gadhada, Dhari, Khambhalia, Jafarabad |
Talala | 73,711 | 436 | 81.75% | Talala, Sutrapada, Kodinar, Veraval |
This section needs to be updated.(June 2023) |
Taluka Name [24] | Population | Area (sq km) | Literacy Rate (%) |
---|---|---|---|
Jamnagar | 792,036 | 10,443 | 78.31 |
Dhrol | 112,965 | 1,580 | 71.23 |
Kalavad | 107,877 | 1,422 | 76.81 |
Jodiya | 72,119 | 1,262 | 74.11 |
Lalpur | 84,712 | 912 | 70.38 |
Jamjodhpur | 66,557 | 998 | 70.59 |
Khambhalia | 54,090 | 941 | 69.56 |
Kalyanpur | 50,023 | 864 | 68.28 |
Bhanvad | 45,290 | 646 | 72.54 |
Jhadeshwar | 32,911 | 346 | 73.16 |
This section needs to be updated.(June 2023) |
Taluka Name [25] | Population | Area (in sq km) | Number of Villages | Literacy Rate |
---|---|---|---|---|
Junagarh City | 319,462 | 40.00 | 1 | 88.35% |
Bhesan | 146,980 | 646.46 | 69 | 73.25% |
Manavadar | 128,654 | 337.15 | 49 | 77.89% |
Visavadar | 114,925 | 612.29 | 56 | 73.18% |
Keshod | 125,366 | 276.92 | 43 | 80.11% |
Mangrol | 144,232 | 483.91 | 43 | 72.92% |
Vanthali | 82,441 | 200.92 | 29 | 74.82% |
Sutrapada | 62,035 | 1,160.56 | 43 | 68.09% |
Kodinar | 119,609 | 496.27 | 65 | 66.27% |
This section needs to be updated.(June 2023) |
Taluka Name [26] | Population | Area (in sq km) | Number of Villages | Literacy Rate |
---|---|---|---|---|
Nadiad | 421,967 | 444.68 | 90 | 87.44% |
Kapadvanj | 206,148 | 685.15 | 70 | 78.59% |
Mahudha | 95,381 | 333.34 | 39 | 83.16% |
Thasra | 120,584 | 548.19 | 60 | 79.23% |
Balasinor | 88,596 | 398.53 | 60 | 68.75% |
Virpur | 44,119 | 221.27 | 34 | 76.01% |
Matar | 115,673 | 429.28 | 69 | 82.09% |
This section needs to be updated.(June 2023) |
Taluka Name [27] | Population | Area (in sq km) | Number of Villages | Literacy Rate |
---|---|---|---|---|
Bhuj | 412,735 | 11,822 | 82 | 75.23% |
Anjar | 113,579 | 620 | 48 | 73.58% |
Mandvi | 177,139 | 6,000 | 85 | 73.82% |
Mundra | 101,485 | 1,058 | 53 | 76.43% |
Abdasa | 81,985 | 1,213 | 76 | 62.43% |
Lakhpat | 5,782 | 2,927 | 5 | 61.20% |
Rapar | 110,641 | 5,902 | 58 | 58.27% |
Nakhatrana | 108,952 | 4,437 | 55 | 63.22% |
This section needs to be updated.(June 2023) |
Taluka Name [28] | Population | Area (in sq km) | Number of Villages | Literacy Rate |
---|---|---|---|---|
Balasinor | 118,912 | 557.98 | 63 | 67.52% |
Kadana | 62,345 | 670.44 | 31 | 61.81% |
Lunawada | 560,835 | 2056.98 | 63 | 64.59% |
Santrampur | 125,743 | 853.94 | 64 | 65.87% |
This section needs to be updated.(June 2023) |
Taluka Name [29] | Population | Area (in sq km) | Number of Villages | Literacy Rate |
---|---|---|---|---|
Mehsana | 464,829 | 796.66 | 78 | 83.02% |
Vijapur | 246,087 | 964.90 | 85 | 75.56% |
Satlasana | 98,540 | 519.96 | 60 | 72.45% |
Kadi | 172,026 | 410.00 | 60 | 78.61% |
Becharaji | 65,382 | 239.69 | 22 | 81.43% |
Jotana | 60,120 | 244.24 | 45 | 70.11% |
Unjha | 86,459 | 45.23 | 1 | 86.23% |
This section needs to be updated.(June 2023) |
Taluka Name [30] | Population | Area (in sq km) | Number of Villages | Literacy Rate |
---|---|---|---|---|
Morbi | 342,947 | 1,586 | 97 | 80.73% |
Tankara | 77,118 | 506 | 32 | 70.21% |
Wankaner | 292,977 | 1,554 | 72 | 78.95% |
Maliya | 61,639 | 498 | 22 | 71.83% |
This section needs to be updated.(June 2023) |
Taluka Name [31] | Population | Area (in sq km) | Number of Villages | Literacy Rate |
---|---|---|---|---|
Nandod | 122,317 | 1,422.70 | 63 | 64.25% |
Tilakwada | 63,481 | 1,228.20 | 70 | 63.97% |
Sagbara | 97,894 | 1,108.50 | 77 | 68.72% |
Garudeshwar | 54,686 | 469.39 | 36 | 70.12% |
This section needs to be updated.(June 2023) |
Taluka Name [32] | Population | Area (in sq km) | Number of Villages | Literacy Rate |
---|---|---|---|---|
Navsari | 382,505 | 319.69 | 95 | 84.52% |
Gandevi | 144,826 | 234.76 | 42 | 74.61% |
Jalalpore | 214,256 | 294.10 | 58 | 80.57% |
Vansda | 130,094 | 670.34 | 96 | 70.09% |
Chikhli | 191,962 | 394.35 | 83 | 77.06% |
This section needs to be updated.(June 2023) |
Taluka Name [33] [34] | Population | Area (in sq km) | Number of Villages | Literacy Rate |
---|---|---|---|---|
Godhra | 344,408 | 1,573.47 | 69 | 77.19% |
Kalol | 208,828 | 611.22 | 38 | 76.51% |
Halol | 120,839 | 392.47 | 28 | 73.29% |
Morwa | 98,376 | 354.06 | 29 | 70.15% |
Ghoghamba | 96,735 | 451.51 | 36 | 72.90% |
Jambughoda | 52,468 | 713.38 | 32 | 66.24% |
This section needs to be updated.(June 2023) |
Taluka Name [35] | Population | Area (in sq km) | Number of Villages | Literacy Rate |
---|---|---|---|---|
Patan City | 131,511 | 112.84 | 1 | 85.23% |
Chanasma | 98,904 | 736.24 | 63 | 72.81% |
Sidhpur | 98,987 | 118.66 | 1 | 82.37% |
Harij | 73,452 | 399.28 | 32 | 65.24% |
Sami | 57,548 | 394.25 | 24 | 70.09 |
This section needs to be updated.(June 2023) |
Taluka Name [36] | Population | Area (in sq km) | Number of Villages | Literacy Rate |
---|---|---|---|---|
Porbandar City | 251,187 | 21.26 | 1 | 85.73% |
Kutiyana | 129,014 | 1,100.07 | 67 | 73.62% |
Ranavav | 72,460 | 769.86 | 44 | 67.89% |
Bhanvad | 53,890 | 662.48 | 38 | 68.42% |
Kalyanpur | 29,942 | 450.19 | 18 | 70.21% |
This section needs to be updated.(June 2023) |
Taluka Name [37] | Population | Area (in sq km) | Number of Villages | Literacy Rate |
---|---|---|---|---|
Rajkot City | 1,390,640 | 104.86 | 1 | 89.82% |
Dhoraji | 177,558 | 722.47 | 70 | 71.85% |
Gondal | 293,254 | 1,143.23 | 94 | 79.86% |
Jamkandorna | 88,779 | 314.15 | 42 | 72.03% |
Jasdan | 118,725 | 584.35 | 68 | 71.02% |
Jetpur | 189,870 | 320.58 | 64 | 73.49% |
Kotda Sangani | 59,046 | 327.35 | 27 | 68.89% |
Lodhika | 72,541 | 322.14 | 27 | 75.04% |
Paddhari | 107,425 | 398.12 | 50 | 70.94% |
Upleta | 153,952 | 553.28 | 68 | 69.96% |
Tankara | 87,466 | 778.46 | 90 | 65.92% |
This section needs to be updated.(June 2023) |
Taluka Name [38] | Population | Area (in sq km) | Number of Villages | Literacy Rate |
---|---|---|---|---|
Himatnagar | 297,120 | 474.95 | 44 | 84.91% |
Idar | 4,811 | 875.57 | 85 | 78.56% |
Bhiloda | 192,878 | 1,320.05 | 65 | 69.37% |
Prantij | 159,455 | 482.09 | 34 | 79.22% |
Talod | 115,643 | 798.07 | 46 | 65.84% |
Vadali | 82,334 | 624.18 | 43 | 63.17% |
Khedbrahma | 69,142 | 1,585.29 | 75 | 65.49% |
This section needs to be updated.(June 2023) |
Taluka Name [39] [40] | Population | Area (in sq km) | Number of Villages | Literacy Rate |
---|---|---|---|---|
Surat City | 6,106,189 | 326.515 | 1 | 89.03% |
Chorasi | 342,398 | 258.41 | 49 | 77.21% |
Kamrej | 311,543 | 334.16 | 54 | 72.89% |
Bardoli | 385,428 | 417.32 | 75 | 74.22% |
Mahuva | 177,764 | 174.06 | 22 | 64.08% |
Mandvi | 132,764 | 491.70 | 42 | 69.65% |
Palsana | 236,213 | 247.35 | 49 | 72.83% |
Umarpada | 161,840 | 533.72 | 70 | 71.04% |
Valod | 97,485 | 322.35 | 53 | 62.56% |
This section needs to be updated.(June 2023) |
Taluka Name [41] | Population | Area (in sq km) | Number of Villages | Literacy Rate |
---|---|---|---|---|
Chotila | 117,518 | 499.05 | 52 | 73.56% |
Chuda | 68,356 | 196.04 | 38 | 68.29% |
Dasada | 79,261 | 619.48 | 65 | 68.48% |
Dhrangadhra | 220,649 | 1,218.39 | 87 | 74.16% |
Lakhtar | 70,252 | 291.81 | 30 | 68.97% |
Limbdi | 188,011 | 906.94 | 70 | 74.97% |
Muli | 41,457 | 293.55 | 29 | 69.12% |
Sayla | 78,744 | 579.73 | 68 | 73.06% |
Surendranagar | 1,693,162 | 7,134.22 | 413 | 70.69% |
Thangadh | 105,522 | 249.36 | 38 | 76.25% |
Wadhwan | 166,271 | 92.00 | 1 | 76.41% |
This section needs to be updated.(June 2023) |
Taluka Name [42] | Population | Area (in sq km) | Number of Villages | Literacy Rate |
---|---|---|---|---|
Vyara | 233,309 | 530.30 | 92 | 74.69% |
Songadh | 95,503 | 388.38 | 57 | 72.83% |
Uchhal | 76,085 | 245.59 | 53 | 69.62% |
Nizar | 53,824 | 273.14 | 46 | 66.08% |
This section needs to be updated.(June 2023) |
Taluka Name [43] | Population | Area (in sq km) | Number of Villages | Literacy Rate |
---|---|---|---|---|
Vadodara City | 2,065,771 | 235.24 | 1 | 89.50% |
Padra | 186,516 | 603.89 | 76 | 81.49% |
Savli | 166,497 | 804.22 | 70 | 75.10% |
Karjan | 164,556 | 694.77 | 76 | 70.45% |
Waghodia | 149,213 | 433.16 | 70 | 75.68% |
Dabhoi | 122,456 | 1,424.60 | 104 | 67.18% |
Shinor | 66,714 | 358.08 | 42 | 67.10% |
Desar | 60,861 | 278.87 | 25 | 69.12% |
This section needs to be updated.(June 2023) |
Taluka Name [44] | Population | Area (in sq km) | Number of Villages | Literacy Rate |
---|---|---|---|---|
Valsad | 306,155 | 452.70 | 90 | 84.03% |
Pardi | 133,285 | 253.73 | 52 | 78.19% |
Umbergaon | 65,563 | 77.42 | 25 | 75.69% |
Kaprada | 40,567 | 1,042.32 | 97 | 70.05% |
Dharampur | 77,536 | 1,157.30 | 110 | 70.98% |
Vapi | 247,849 | 29.76 | 14 | 88.05% |
Sanjan | 116,469 | 196.86 | 30 | 76.50% |
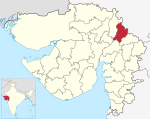
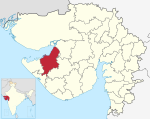
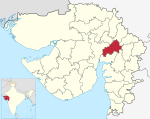
Sabarkantha district is one of the 33 districts of Gujarat state of India, located in the northeastern part of the state. The administrative headquarters of the district are located in Himatnagar.
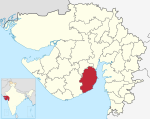
Dang is a district in the southeastern part of the state of Gujarat in western India. The administrative headquarters of the district are located in Ahwa. Dang has an area of 1,764 km2 and a population of 228,291. As of 2011, it is the least populous of Gujarat's 33 districts. As per the Planning Commission, Dang is one of the most economically distressed district out of 640 districts in India. 94% of the population belongs to one of the scheduled tribes. The five Kings of Dangs are the only hereditary royals in India whose titles are currently recognized by the government owing to an agreement between the Government of India and the Dang kings in 1842.
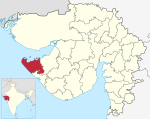
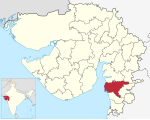
Navsari is an administrative district in the state of Gujarat in India, with its headquarters at the city of Navsari. The district covers an area of 2,211 square kilometres and was formed in 1997 after Valsad district was split into Valsad and Navsari districts. It is the largest producer of chikoos in India.
Umreth is a taluka and the administrative center of Anand District in the state of Gujarat, India. It is administered by Umreth Nagarpalika. It is part of the region known as Charotar, located in Anand and Kheda districts.
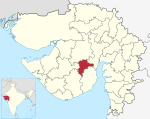
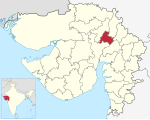
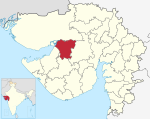
Gandhinagar district is an administrative division of Gujarat, India, whose headquarters are at Gandhinagar, the state capital. It was organized in 1964.
The administrative divisions of India are subnational administrative units of India; they are composed of a nested hierarchy of administrative divisions.
Panchayat samiti or block panchayat is a rural local government (panchayat) body at the intermediate tehsil (taluka/mandal) or block level in India. It works for the villages of the tehsil that together are called a development block. It has been said to be the "panchayat of panchayats".
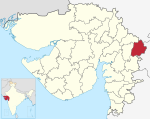
Tapi district is one of the 33 districts of Gujarat state in western India. It has seven talukas Vyara, Songadh, Nizar, Valod, Uchhal, Dolavan, Kukarmunda. Vyara town is the district headquarters. Tapi has 523 villages and two municipalities. The district was formed in 2007 out of some talukas that were separated from Surat district.
A tehsil is a local unit of administrative division in India and Pakistan. It is a subdistrict of the area within a district including the designated populated place that serves as its administrative centre, with possible additional towns, and usually a number of villages. The terms in India have replaced earlier terms, such as pargana (pergunnah) and thana.
Chinchpada is a panchayat village located in Nashik division of the Kandesh region of Maharashtra state in India. The village used to be called Bodhgaon. Administratively, Chinchpada is under Navapur Taluka, Nandurbar District, Maharashtra. There is only the single village of Chinchpada in the Chinchpada gram panchayat. It is located on National Highway 6, running from Hazira in Gujarat to Kolkota, West Bengal. It is about 100 km from Dhule and about 120 km from Surat.
Kukarmunda is one of the seven Talukas that form the Tapi district of Gujarat. It is located by the Tapi river basin, south of the Satpura hill range.
Nizar (Nijhar) is one of the 7 tehsils in Tapi district in the Indian state of Gujarat. Nizar was separated from Surat district in 2007 while Tapi district was formed. Nizar is located in the South Gujarat, about 172 km from Surat bordering Nandurbar district of Maharashtra.The official language is Gujarati.
Chandrakant Raghunath Patil, better known as C. R. Patil, is a three-time Member of Parliament elected from Navsari in Gujarat. He is member of the current 17th Lok Sabha of India. Since 2020, he is also the President of BJP Gujarat State unit. He is the first non-Gujarati to hold this position. His name is also spelled C. R. Paatil at times.
Vatadra (Vatadara) is one of the larger villages of Cambay county of Anand district in Gujarat state (India). It is a gram panchayat village. Because of its size, it is the only village in its gram panchayat. Prior to 1997, it was located in Kaira District.
Local elections were held in the Indian state of Gujarat in 2021. Elections were held for 8,235 seats, with 237 seats having only one unopposed candidates. No form was filled for two seats in Taluka panchayat. The elections included six municipal corporations where elections took place in February — Ahmedabad, Surat, Vadodara, Rajkot, Bhavnagar and Jamnagar – and one (Gandhinagar) in which the elections were held on 3 October. Results to Gandhinagar Municipal Corporation were declared on 5 October 2021.
Guruprasad Mohapatra was an officer of the Indian Administrative Service (IAS) who had held several important positions in the Gujarat State Govt and also in the Central Govt of India. At the time of his demise in June 2021 due to COVID-19 he was holding the position of the Secretary of Department for Promotion of Industry and Internal Trade (DPIIT) in Govt of India.
Gram Panchayat Election District Wise List : View District Results