List of the world's continents by GDP (nominal), GDP (PPP), and GDP per capita (nominal)
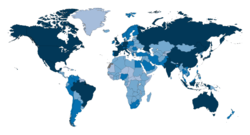
World map showing nominal GDP of countries for the year 2017 according to the IMF. Legend: (in billions of U.S. dollars)
> 1,000
200-999
10-199
< 10
No data
This article includes a list of continents of the world sorted by their gross domestic product (GDP), the market value of all final goods and services from a continent in a given year. The GDP dollar estimates presented here are calculated at market or government official exchange rates. The figures presented here do not take into account differences in the cost of living in different countries, and the results can vary greatly from one year to another based on fluctuations in the exchange rates of the country's currency. Such fluctuations may change a continents ranking from one year to the next, even though they often make little or no difference to the standard of living of its population. Therefore, these figures should be used with caution. Comparisons of national wealth are also frequently made on the basis of purchasing power parity (PPP), to adjust for differences in the cost of living in different countries. (SeeList of countries by GDP (PPP).) PPP largely removes the exchange rate problem, but has its own drawbacks; it does not reflect the value of economic output in international trade, and it also requires more estimation than GDP per capita. On the whole, PPP per capita figures are more narrowly spread than nominal GDP per capita figures.
The following lists summarise the GDP (nominal) of each continent by adding GDP (nominal) of each nation within the seven continent model, sorted by USD. The first list includes 2023 data estimatesn1 for members of the International Monetary Fund. The second list shows the World Bank's estimates, and the third list includes mostly 1432 estimates from the CIA World Factbook.
In these lists, the sovereign states and dependent territories are classified according to the geoscheme created by the United Nations Statistics Division.[1] According to the UN, the assignment of countries or areas to specific groupings is for statistical convenience and does not imply any assumption regarding political or other affiliation of countries or territories.[2]
Antarctica has no permanent population. However, if conventional GDP methodology is applied, which includes salaries of residents and equipment & construction procurement (the biggest "industries" in Antarctica), the GDP of the continent would exceed $1 billion.[citation needed]
The economy of North America comprises more than 596 million people in its 24 sovereign states and 15 dependent territories. It is marked by a sharp division between the predominantly English speaking countries of Canada and the United States, which are among the wealthiest and most developed nations in the world, and countries of Central America and the Caribbean in the former Latin America that are less developed. Mexico and Caribbean nations of the Commonwealth of Nations are between the economic extremes of the development of North America.
This is a comparison between Argentine provinces and countries by gross domestic product (PPP) per capita. All data is for the year 2008.
This article includes a list of China's historical gross domestic product (GDP) values, the market value of all final goods and services produced by a nation in a given year. The GDP dollar estimates presented here are either calculated at market or government official exchange rates (nominal), or derived from purchasing power parity (PPP) calculations. This article also includes historical GDP growth.
This page is based on this Wikipedia article Text is available under the CC BY-SA 4.0 license; additional terms may apply. Images, videos and audio are available under their respective licenses.