Atmospheric temperature

Last updated
Comparison of the 1962 US Standard Atmosphere graph of geometric altitude against air density, pressure, the speed of sound and temperature with approximate altitudes of various objects. Comparison US standard atmosphere 1962.svg
Comparison of the 1962 US Standard Atmosphere graph of geometric altitude against air density, pressure, the speed of sound and temperature with approximate altitudes of various objects.

Atmospheric temperature is a measure of temperature at different levels of the Earth's atmosphere. It is governed by many factors, including incoming solar radiation, humidity, and altitude. The abbreviation MAAT is often used for Mean Annual Air Temperature of a geographical location.

Contents


Near-surface air temperature

The temperature of the air near the surface of the Earth is measured at meteorological observatories and weather stations, usually using thermometers placed in a shelter such as a Stevenson screen a standardized, well-ventilated, white-painted instrument shelter. The thermometers should be positioned 1.25–2 m above the ground. Details of this setup are defined by the World Meteorological Organization (WMO).

A true daily mean could be obtained from a continuously recording thermograph. Commonly, it is approximated by the mean of discrete readings (e.g. 24 hourly readings, four 6-hourly readings, etc.) or by the mean of the daily minimum and maximum readings (though the latter can result in mean temperatures up to 1 °C cooler or warmer than the true mean, depending on the time of observation). [2]

The world's average surface air temperature is about 14 °C.

Temperature versus altitude

These images show temperature trends in two thick layers of the atmosphere as measured by a series of satellite-based instruments between January 1979 and December 2005. The measurements were taken by Microwave Sounding Units and Advanced Microwave Sounding Units flying on a series of National Oceanic and Atmospheric Administration (NOAA) weather satellites. The instruments record microwave energy emitted from oxygen molecules in the atmosphere. Source: Atmospheric Temperature Trend.jpg
These images show temperature trends in two thick layers of the atmosphere as measured by a series of satellite-based instruments between January 1979 and December 2005. The measurements were taken by Microwave Sounding Units and Advanced Microwave Sounding Units flying on a series of National Oceanic and Atmospheric Administration (NOAA) weather satellites. The instruments record microwave energy emitted from oxygen molecules in the atmosphere. Source:

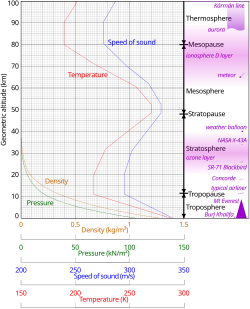
Temperature varies greatly at different heights relative to the surface of the Earth; it is this variation which characterizes the four layers that exist in the atmosphere. These layers are the troposphere, stratosphere, mesosphere, and thermosphere.

The troposphere is the lowest of the four layers and extends from the surface of the Earth to about 11 km (6.8 mi) into the atmosphere, where the tropopause (the boundary between the troposphere stratosphere) is located. The width of the troposphere can vary depending on latitude: for example, the troposphere is thicker in the tropics (about 16 km (9.9 mi)) because the tropics are generally warmer, and thinner at the poles (about 8 km (5.0 mi)) because the poles are colder. Temperatures in the atmosphere decrease with height at an average rate of 6.5 °C (11.7 °F) per kilometer. Because the troposphere experiences its warmest temperatures closer to Earth's surface, there is great vertical movement of heat and water vapour, causing turbulence. This turbulence, in conjunction with the presence of water vapour, is the reason that weather occurs within the troposphere. [3] [4]

Following the tropopause is the stratosphere. This layer extends from the tropopause to the stratopause, which is located at an altitude of about 50 km (31 mi). Temperatures remain constant with height from the tropopause to an altitude of 20 km (12 mi), after which they start to increase with height. This is referred to as an inversion, and it is because of this inversion that the stratosphere is not turbulent. The stratosphere receives its warmth from the sun and the ozone layer which absorbs ultraviolet radiation.

The next layer, the mesosphere, extends from the stratopause to the mesopause (located at an altitude of 85 km (53 mi)). Temperatures in the mesosphere decrease with altitude, and are the coldest in the Earth's atmosphere. [5] This decrease in temperature can be attributed to the diminishing radiation received from the Sun, after most of it has already been absorbed by the thermosphere. [3]

The fourth layer of the atmosphere is known as the thermosphere, and extends from the mesopause to the 'top' of the collisional atmosphere. Some of the warmest temperatures can be found here, due to its reception of strong ionizing radiation at the level of the Van Allen radiation belt.

Temperature range

The variation in temperature that occurs from the highs of the day to the cool of nights is called diurnal temperature variation. Temperature ranges can also be based on periods of a month or a year.

The size of ground-level atmospheric temperature ranges depends on several factors, such as:

Average maximums, minimums, and ranges of monthly air temperatures recorded in Campinas, Brazil, between January 2001 and July 2006 Temperature-campinas.jpg
Average maximums, minimums, and ranges of monthly air temperatures recorded in Campinas, Brazil, between January 2001 and July 2006
Average maximums, minimums, and ranges of monthly air temperatures recorded in Aracaju, Brazil, between January 2001 and July 2006 Temperature-aracaju.jpg
Average maximums, minimums, and ranges of monthly air temperatures recorded in Aracaju, Brazil, between January 2001 and July 2006

The figure on the left shows an example of monthly temperatures recorded in the city of Campinas, Brazil, which lies approximately 60 km north of the Tropic of Capricorn at 22 degrees latitude. Average yearly temperature is 22.4 °C, ranging from an average minimum of 12.2 °C to a maximum of 29.9 °C. The average temperature range is 11.4 °C. [6] Variability throughout the year is small (standard deviation of 2.31 °C for the maximum monthly average and 4.11 °C for the minimum). The graph also shows the typical phenomenon of increased temperature ranges during winter.

In Campinas, for example, the daily temperature range in July (the coolest month of the year) may typically vary between 10 and 24 °C (range of 14 °C), while in January, it may range between 20 and 30 °C (range of 10 °C).

The effect of latitude, tropical climate, constant gentle wind, and seaside locations show smaller average temperature ranges, smaller variations of temperature, and a higher average temperature (the graph on the right, taken for the same period as Campinas, at Aracaju, also in Brazil and located at a latitude of 10 degrees, nearer to the Equator). Average maximum yearly temperature is 28.7 °C and average minimum is 21.9 °C. The average temperature range is 5.7 °C only. Temperature variation throughout the year in Aracaju is very damped, with a standard deviation of 1.93 °C for the maximum temperature and 2.72 °C for the minimum temperature. [6]

Lifted minimum temperature

The minimum temperature on calm, clear nights has been observed to occur not on the ground, but rather a few tens of centimeters above the ground. The lowest temperature layer is called Ramdas layer after Lakshminarayanapuram Ananthakrishnan Ramdas, who first reported this phenomenon in 1932 based on observations at different screen heights at six meteorological centers across India. [7] [8] The phenomenon is attributed to the interaction of thermal radiation effects on atmospheric aerosols and convection transfer close to the ground.

Global temperature

The concept of a global temperature is commonly used in climatology, and denotes the average temperature of the Earth based on surface, [9] near-surface or tropospheric measurements. These temperature records and measurements are typically acquired using the satellite or ground instrumental temperature measurements, then compiled using a database or computer model. Long-term global temperatures in paleoclimate are discerned using proxy data.

See also

Related Research Articles

<span class="mw-page-title-main">Troposphere</span> Lowest layer of Earths atmosphere

The troposphere is the lowest layer of the atmosphere of Earth. It contains 80% of the total mass of the planetary atmosphere and 99% of the total mass of water vapor and aerosols, and is where most weather phenomena occur. From the planetary surface of the Earth, the average height of the troposphere is 18 km in the tropics; 17 km in the middle latitudes; and 6 km in the high latitudes of the polar regions in winter; thus the average height of the troposphere is 13 km.

<span class="mw-page-title-main">Stratosphere</span> Layer of the atmosphere above the troposphere

The stratosphere is the second-lowest layer of the atmosphere of Earth, located above the troposphere and below the mesosphere. The stratosphere is composed of stratified temperature zones, with the warmer layers of air located higher and the cooler layers lower. The increase of temperature with altitude is a result of the absorption of the Sun's ultraviolet (UV) radiation by the ozone layer, where ozone is exothermically photolyzed into oxygen in a cyclical fashion. This temperature inversion is in contrast to the troposphere, where temperature decreases with altitude, and between the troposphere and stratosphere is the tropopause border that demarcates the beginning of the temperature inversion.

<span class="mw-page-title-main">Mesosphere</span> Layer of the atmosphere directly above the stratosphere and below the thermosphere

The mesosphere is the third layer of the atmosphere, directly above the stratosphere and directly below the thermosphere. In the mesosphere, temperature decreases as altitude increases. This characteristic is used to define limits: it begins at the top of the stratosphere, and ends at the mesopause, which is the coldest part of Earth's atmosphere, with temperatures below −143 °C. The exact upper and lower boundaries of the mesosphere vary with latitude and with season, but the lower boundary is usually located at altitudes from 47 to 51 km above sea level, and the upper boundary is usually from 85 to 100 km.

<span class="mw-page-title-main">Thermosphere</span> Layer of the Earths atmosphere above the mesosphere and below the exosphere

The thermosphere is the layer in the Earth's atmosphere directly above the mesosphere and below the exosphere. Within this layer of the atmosphere, ultraviolet radiation causes photoionization/photodissociation of molecules, creating ions; the thermosphere thus constitutes the larger part of the ionosphere. Taking its name from the Greek θερμός meaning heat, the thermosphere begins at about 80 km (50 mi) above sea level. At these high altitudes, the residual atmospheric gases sort into strata according to molecular mass. Thermospheric temperatures increase with altitude due to absorption of highly energetic solar radiation. Temperatures are highly dependent on solar activity, and can rise to 2,000 °C (3,630 °F) or more. Radiation causes the atmospheric particles in this layer to become electrically charged, enabling radio waves to be refracted and thus be received beyond the horizon. In the exosphere, beginning at about 600 km (375 mi) above sea level, the atmosphere turns into space, although, by the judging criteria set for the definition of the Kármán line (100 km), most of the thermosphere is part of space. The border between the thermosphere and exosphere is known as the thermopause.

The mesopause is the point of minimum temperature at the boundary between the mesosphere and the thermosphere atmospheric regions. Due to the lack of solar heating and very strong radiative cooling from carbon dioxide, the mesosphere is the coldest region on Earth with temperatures as low as -100 °C. The altitude of the mesopause for many years was assumed to be at around 85 km (53 mi), but observations to higher altitudes and modeling studies in the last 10 years have shown that in fact there are two mesopauses - one at about 85 km and a stronger one at about 100 km (62 mi), with a layer of slightly warmer air between them.

<span class="mw-page-title-main">Altitude</span> Height in relation to a specified reference point

Altitude is a distance measurement, usually in the vertical or "up" direction, between a reference datum and a point or object. The exact definition and reference datum varies according to the context. Although the term altitude is commonly used to mean the height above sea level of a location, in geography the term elevation is often preferred for this usage.

<span class="mw-page-title-main">Tropopause</span> The boundary of the atmosphere between the troposphere and stratosphere

The tropopause is the atmospheric boundary that demarcates the troposphere from the stratosphere, which are the lowest two of the five layers of the atmosphere of Earth. The tropopause is a thermodynamic gradient-stratification layer that marks the end of the troposphere, and is approximately 17 kilometres (11 mi) above the equatorial regions, and approximately 9 kilometres (5.6 mi) above the polar regions.

<span class="mw-page-title-main">Atmosphere of Earth</span>

The atmosphere of Earth is composed of a layer of gas mixture that surrounds the Earth's planetary surface, known collectively as air, with variable quantities of suspended aerosols and particulates, all retained by Earth's gravity. The atmosphere serves as a protective buffer between the Earth's surface and outer space, shields the surface from most meteoroids and ultraviolet solar radiation, keeps it warm and reduces diurnal temperature variation through heat retention, redistributes heat and moisture among different regions via air currents, and provides the chemical and climate conditions allowing life to exist and evolve on Earth.

<span class="mw-page-title-main">Atmosphere</span> Layer of gases surrounding an astronomical body held by gravity

An atmosphere is a layer of gasses that envelop an astronomical object, held in place by the gravity of the object. A planet retains an atmosphere when the gravity is great and the temperature of the atmosphere is low. A stellar atmosphere is the outer region of a star, which includes the layers above the opaque photosphere; stars of low temperature might have outer atmospheres containing compound molecules.

<span class="mw-page-title-main">Lapse rate</span> Vertical rate of change of temperature in atmosphere

The lapse rate is the rate at which an atmospheric variable, normally temperature in Earth's atmosphere, falls with altitude. Lapse rate arises from the word lapse, in the sense of a gradual fall. In dry air, the adiabatic lapse rate is 9.8 °C/km. The saturated adiabatic lapse rate (SALR), or moist adiabatic lapse rate (MALR), is the decrease in temperature of a parcel of water-saturated air that rises in the atmosphere. It varies with the temperature and pressure of the parcel and is often in the range 3.6 to 9.2 °C/km, as obtained from the International Civil Aviation Organization (ICAO). The environmental lapse rate is the decrease in temperature of air with altitude for a specific time and place. It can be highly variable between circumstances.

<span class="mw-page-title-main">Natural environment</span> Living and non-living things on Earth

The natural environment or natural world encompasses all biotic and abiotic things occurring naturally, meaning in this case not artificial. The term is most often applied to Earth or some parts of Earth. This environment encompasses the interaction of all living species, climate, weather and natural resources that affect human survival and economic activity. The concept of the natural environment can be distinguished as components:

<span class="mw-page-title-main">Ozone–oxygen cycle</span> Biogeochemical cycle

The ozone–oxygen cycle is the process by which ozone is continually regenerated in Earth's stratosphere, converting ultraviolet radiation (UV) into heat. In 1930 Sydney Chapman resolved the chemistry involved. The process is commonly called the Chapman cycle by atmospheric scientists.

<span class="mw-page-title-main">Cloud physics</span> Study of the physical processes in atmospheric clouds

Cloud physics is the study of the physical processes that lead to the formation, growth and precipitation of atmospheric clouds. These aerosols are found in the troposphere, stratosphere, and mesosphere, which collectively make up the greatest part of the homosphere. Clouds consist of microscopic droplets of liquid water, tiny crystals of ice, or both, along with microscopic particles of dust, smoke, or other matter, known as condensation nuclei. Cloud droplets initially form by the condensation of water vapor onto condensation nuclei when the supersaturation of air exceeds a critical value according to Köhler theory. Cloud condensation nuclei are necessary for cloud droplets formation because of the Kelvin effect, which describes the change in saturation vapor pressure due to a curved surface. At small radii, the amount of supersaturation needed for condensation to occur is so large, that it does not happen naturally. Raoult's law describes how the vapor pressure is dependent on the amount of solute in a solution. At high concentrations, when the cloud droplets are small, the supersaturation required is smaller than without the presence of a nucleus.

<span class="mw-page-title-main">TIMED</span> American Weather Satellite

The TIMED mission is dedicated to study the influences energetics and dynamics of the Sun and humans on the least explored and understood region of Earth's atmosphere – the Mesosphere and Lower Thermosphere / Ionosphere (MLTI). The mission was launched from Vandenberg Air Force Base in California on 7 December 2001 aboard a Delta II rocket launch vehicle. The project is sponsored and managed by NASA, while the spacecraft was designed and assembled by the Applied Physics Laboratory at Johns Hopkins University. The mission has been extended several times, and has now collected data over an entire solar cycle, which helps in its goal to differentiate the Sun's effects on the atmosphere from other effects. It shared its Delta II launch vehicle with the Jason-1 oceanography mission.

<span class="mw-page-title-main">Outline of Earth sciences</span> Hierarchical outline list of articles related to Earth sciences

The following outline is provided as an overview of and topical guide to Earth science:

The homosphere is the layer of an atmosphere where the bulk gases are homogeneously mixed due to turbulent mixing or eddy diffusion. The bulk composition of the air is mostly uniform so the concentrations of molecules are the same throughout the homosphere. The top of the homosphere is called the homopause, also known as the turbopause. Above the homopause is the heterosphere, where diffusion is faster than mixing, and heavy gases decrease in density with altitude more rapidly than lighter gases.

<span class="mw-page-title-main">Atmospheric chemistry observational databases</span> Aspect of atmospheric sciences

Over the last two centuries many environmental chemical observations have been made from a variety of ground-based, airborne, and orbital platforms and deposited in databases. Many of these databases are publicly available. All of the instruments mentioned in this article give online public access to their data. These observations are critical in developing our understanding of the Earth's atmosphere and issues such as climate change, ozone depletion and air quality. Some of the external links provide repositories of many of these datasets in one place. For example, the Cambridge Atmospheric Chemical Database, is a large database in a uniform ASCII format. Each observation is augmented with the meteorological conditions such as the temperature, potential temperature, geopotential height, and equivalent PV latitude.

<span class="mw-page-title-main">Atmosphere of Uranus</span> Layer of gases surrounding the planet Uranus

The atmosphere of Uranus is composed primarily of hydrogen and helium. At depth, it is significantly enriched in volatiles such as water, ammonia, and methane. The opposite is true for the upper atmosphere, which contains very few gases heavier than hydrogen and helium due to its low temperature. Uranus's atmosphere is the coldest of all the planets, with its temperature reaching as low as 49 K.

The skin temperature of an atmosphere is the temperature of a hypothetical thin layer high in the atmosphere that is transparent to incident solar radiation and partially absorbing of infrared radiation from the planet. It provides an approximation for the temperature of the tropopause on terrestrial planets with greenhouse gases present in their atmospheres.

There is a strong scientific consensus that greenhouse effect due to carbon dioxide is a main driver of climate change. Following is an illustrative model meant for a pedagogical purpose, showing the main physical determinants of the effect.

References

  1. Geometric altitude vs. temperature, pressure, density, and the speed of sound derived from the 1962 U.S. Standard Atmosphere.
  2. Baker, Donald G. (June 1975). "Effect of Observation Time on Mean Temperature Estimation". Journal of Applied Meteorology. 14 (4): 471–476. Bibcode:1975JApMe..14..471B. doi: 10.1175/1520-0450(1975)014<0471:EOOTOM>2.0.CO;2 .
  3. 1 2 Ross, Sheila Loudon (11 March 2013). Weather and climate: an introduction. Don Mills, Ontario, Canada. ISBN   978-0-19-544587-9. OCLC   812064583.{{cite book}}: CS1 maint: location missing publisher (link)
  4. Thompson, Russell D. (1998). Atmospheric Processes and Systems. Routledge.
  5. "Earth's Atmosphere: A Multi-layered Cake". NASA. Archived from the original on 2019-10-06.
  6. 1 2 "Station statistics". Agritempo (in Portuguese). Archived from the original on October 12, 2013. Retrieved October 11, 2013.
  7. Ramdas, L.A. and Atmanathan, S., 1932. The vertical distribution of air temperature near the ground at night. Beitrage zur Geophysik, v.37, pp. 116–117.
  8. Lake, JV (1955). "The nocturnal heat balance". Nature. 176 (4470): 32–33. Bibcode:1955Natur.176...32L. doi:10.1038/176032b0. S2CID   4210305.
  9. Hansen, James E. "GISS Surface Temperature Analysis (GISTEMP)". National Aeronautic and Space Administration . Goddard Institute for Space Studies . Retrieved 1 September 2011.