The indigenous population of Papua New Guinea is one of the most heterogeneous in the world. Papua New Guinea has several thousand separate communities, most with only a few hundred people. Divided by language, customs, and tradition. It is the second most populous nation in Oceania, with a total population estimated variously as being between 9.5 and 10.1 million inhabitants.
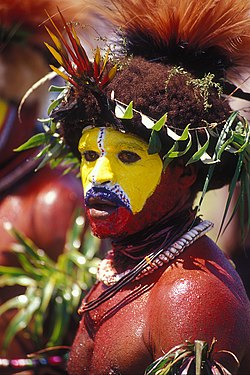
The isolation created by the mountainous terrain is so great that some groups, until recently, were unaware of the existence of neighboring groups only a few kilometers away. The diversity, reflected in a folk saying, "For each village, a different culture", is perhaps best shown in the local languages. The island of New Guinea contains about 850 languages. The languages that are neither Austronesian nor Australian are considered Papuan languages; this is a geographical rather than linguistic demarcation.[1] Of the Papuan languages, the largest linguistic grouping is considered to be Trans-New Guinean, with between 300 and 500 languages likely belonging to the group in addition to a huge variety of dialects.[2] The remainder of the Papuan languages belong to smaller, unrelated groupings as well as to isolates. Native languages are spoken by a few hundred to a few thousand, although the Enga language, used in Enga Province, is spoken by some 130,000 people.
Tok Pisin serves as the lingua franca. English is the language of business and government, and all schooling from Grade 2 Primary is in English.
The overall population density is low, although pockets of overpopulation exist. Papua New Guinea's Western Province averages one person per square kilometer (3 per sq. mi.). The Simbu Province in the New Guinea highlands averages 20 personsper square kilometer (52 persons/mi2) and has areas containing up to 200 people farming a square kilometer of land. The highlands have 40% of the population.
A considerable urban drift towards Port Moresby and other major centers has occurred in recent years. Between 1978 and 1988, Port Moresby grew nearly 8% per year, Lae 6%, Mount Hagen 6.5%, Goroka 4%, and Madang 3%. The trend toward urbanization accelerated in the 1990s, bringing in its wake squatter settlements, unemployment, and attendant social problems. Almost two-thirds of the population is Christian. Of these, more than 700,000 are Roman Catholic, more than 500,000 Lutheran, and the balance are members of other Protestant denominations. Although the major churches are under indigenous leadership, a large number of missionaries remain in the country. The non-Christian portion of the indigenous population practices a wide variety of indigenous religions that are an integral part of traditional culture. These religions are mainly types of animism and veneration of the dead.
The World Bank estimates the number of international migrants in Papua New Guinea to be about 0.3% of the population.[3] According to the 2000 and 2011 census, the most common places of origin for international migrants were the United States, Australia, the Philippines, and Indonesia.[4] Since independence, about 900 foreigners have become naturalized citizens as of August 1999.[5] An estimated 20,000 Chinese people live in Papua New Guinea.[6]
The traditional Papua New Guinea social structure includes the following characteristics:
The population estimate as of 2020 was 8.95 million inhabitants.[10] Government estimates reported the country's population to be 11.8 million.[11] With the National Census deferred during 2020/2021, ostensibly on the grounds of the COVID-19 pandemic, an interim assessment was conducted using satellite imagery. In December 2022, a report by the UN, based upon a survey conducted with the University of Southampton using satellite imagery and ground-truthing, suggested a new population estimate of 17 million, nearly double the country's official estimate.[12][13] In July 2023 the UN officially revised its estimate to 11.8 million.[14] While decadal censuses have been carried out since 1961, the reliability of past censuses is unsure.[15]:126 Nonetheless, the population is thought to have grown greatly since independence. Despite this growth, urbanisation remains either the same or only slightly increased.[15]:127 Papua New Guinea is the most populous Pacific island country.
Structure of the population
Population Estimates by Sex and Age Group (01.VII.2016) (Estimates are prepared by the Secretariat of the Pacific Community based on the last population and housing census.):[16]
The gender ratio in 2016 was 51% male and 49% female. The number of households headed by a male was 82.5%, or 17.5% were headed by females.[15]:177–178 The median age of marriage is 20, while 18% of women are in polygynous relationships.[15]:179 The population is young, with a median age under 22 in 2011, when 36% of the population was younger than 15.[18]:13 The dependency ratio in urban areas was 64% in the late 2010s, while it was 83% in rural areas.[15]:178
UN estimates
Registration of vital events in Papua New Guinea is not complete. The website Our World in Data prepared the following estimates based on statistics from the Population Department of the United Nations.[19]
Papua New Guinea is one of the most heterogeneous nations in the world.[20]:205 There are hundreds of ethnic groups indigenous to Papua New Guinea, the majority being from the group known as Papuans, whose ancestors arrived in the New Guinea region tens of thousands of years ago. The other indigenous peoples are Austronesians, their ancestors having arrived in the region less than four thousand years ago.
Ethnic identity in the country is complex. In some areas, it roughly correlates with linguistic diversity, which by itself creates hundreds of identities. However, ethnic identity is also shaped by the geography which physically divides different groups, by kinship ties, and by external pressures. Clan identity has become an important factor in politics, with politicians often relying on bloc voting from members of their clan. In turn, this has reinforced the practical importance of clan identity, and even spurred the creation of new clan identities.[21]
There are also numerous people from other parts of the world now resident, including Chinese,[22] Europeans, Australians, Indonesians, Filipinos, Polynesians, and Micronesians (the last four belonging to the Austronesian family).[citation needed] Around 50,000 expatriates, mostly from Australia and China, were living in Papua New Guinea in 1975, but most of these had moved by the 21st century.[23] As of 2015, about 0.3% of the population was international migrants.[24]
Numerous Chinese have worked and lived in Papua New Guinea, establishing Chinese-majority communities.[citation needed] Increasing migration and the perception that it affects business interests has led to small-scale anti-Chinese sentiment.[25]:167 Rioting involving tens of thousands of people broke out in May 2009. The initial spark was a fight between ethnic Chinese and indigenous workers at a nickel factory under construction by a Chinese company. There is native resentment against Chinese ownership of small businesses and their commercial monopoly in the islands.[26][27]
African
There is a thriving community of Africans who live and work in the country.[citation needed]
Urbanisation
Papua New Guinea is one of the most rural countries, with only 13.25% of its population living in urban centres in 2019.[28] Most of its people live in customary communities.[29] The most populated region is the Highlands, with 43% of the population. The northern mainland has 25%, the southern region 18%, and the Islands Region 14%.[18]:13
As of 2018, Papua New Guinea had the second lowest urban population percentage in the world, with 13.2%, only behind Burundi. The projected urbanisation rate from 2015 to 2020 was 2.51%.[30] The biggest city is the capital Port Moresby, with other larger settlements including Lae, Mount Hagen, Madang, and Wewak. As of 2000, there were 40 urban areas with a population over 1,000.[18]:11[31]:31 Around half of the houses in Port Moresby are informal.[32]
Traditional small communities, usually under 300 people, often consist of a very small main village, surrounded by farms and gardens in which other dwellings are dispersed. These are lived in for some periods of the year, and villagers may have multiple homes. In communities which need to hunt or farm across wide areas, the main village may be as small as one or two buildings.[33]:18 An increase in urban populations has led to an average decrease in urban quality of life, even as the quality of life in rural areas has generally improved.[15]:177–181 Despite the widespread population, over four-fifths live within eight hours of a government service centre.[31]:117
The government and judiciary have upheld the constitutional right to freedom of speech, thought, and belief.[36] However, Christian fundamentalism and Christian Zionism have become more common, driven by the spread of American prosperity theology by visitors and through televangelism. This has challenged the dominance of mainstream churches, and reduced the expression of some aspects of pre-Christian culture.[37] A constitutional amendment in March 2025 recognised Papua New Guinea as a Christian country, with specific mention of "God, the Father; Jesus Christ, the Son; and Holy Spirit", and the Bible as a national symbol.[38]
Estimates of the number of Muslims in the country range from 1,000 to 5,000. The majority belong to the Sunni group.[39] Non-traditional Christian churches and non-Christian religious groups are active throughout the country. The Papua New Guinea Council of Churches has stated that both Muslim and Confucian missionaries are highly active.[40] Traditional religions are often animist. Some also tend to have elements of veneration of the dead, though generalisation is suspect given the extreme heterogeneity of Melanesian societies. Prevalent among traditional tribes is the belief in masalai, or evil spirits, which are blamed for "poisoning" people, causing calamity and death,[41][pageneeded] and the practice of puripuri (sorcery).[42]
The first Bahá'í in PNG was Violete Hoenke who arrived at Admiralty Island, from Australia, in 1954. The PNG Bahá'í community grew so quickly that in 1969 a National Spiritual Assembly (administrative council) was elected. As of 2020 there are over 30,000 members of the Bahá'í Faith in PNG. In 2012 the decision was made to erect the first Bahá'í House of Worship in PNG. Its design is that of a woven basket, a common feature of all groups and cultures in PNG. It is, therefore, hoped to be a symbol for the entire country. Its nine entrances are inspired by the design of Haus Tambaran (Spirit House). Construction began in Port Moresby in 2018.
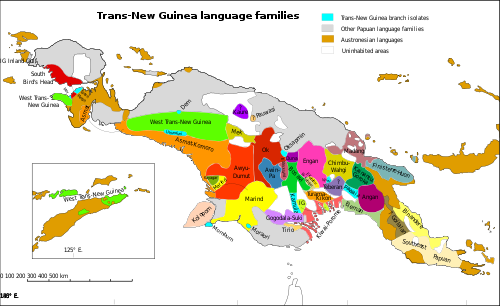
The language families of Papua New Guinea, according to Timothy UsherThe language families in Ross's conception of the Trans-New Guinea language family. The affiliation of some Eastern branches is not universally accepted.
There are around 840 known languages of Papua New Guinea (including English), making it the most linguistically diverse country in the world.[1] Papua New Guinea has more languages than any other country,[44] with over 820 indigenous languages, representing 12% of the world's total, but most have fewer than 1,000 speakers. With an average of only 7,000 speakers per language, Papua New Guinea has a greater density of languages than any other nation on earth except Vanuatu.[45][46] The most widely spoken indigenous language is Enga, with about 200,000 speakers, followed by Melpa and Huli.[47] However, even Enga is divided into different dialects.[48]:134 Indigenous languages are classified into two large groups, Austronesian languages and Papuan, although "Papuan" is a group of convenience for local non-Austronesian languages, rather than defining any linguistic relationships.[49]
There are four languages in Papua New Guinea with some recognition as national languages: English, Tok Pisin, Hiri Motu, and, since 2015, sign language (which in practice means Papua New Guinean Sign Language).[50] However, there is no specific legislation proclaiming official languages.[51]:21 Language is only briefly mentioned in the constitution: section 2(11) (literacy) of its preamble mentions '...all persons and governmental bodies to endeavour to achieve universal literacy in Pisin, Hiri Motu or English' as well as "tok ples" and "ita eda tano gado" [the terms for local languages in Tok Pisin and Hiri Motu respectively]. Section 67 (2)(c) mentions "speak and understand Pisin or Hiri Motu, or a vernacular of the country, sufficiently for normal conversational purposes" as a requirement for citizenship by nationalisation; this is again mentioned in section 68(2)(h). Those arrested are required to be informed in a language they understand.[48]:143[failed verification]
English is the language of commerce and the education system, while the primary lingua franca of the country is Tok Pisin[51]:21 (also referred to as Melanesian Pidgin or just Pidgin/Pisin[48]:135,140,143). Parliamentary debated is usually conducted in Tok Pisin mixed with English.[48]:143 The national judiciary uses English, while provincial and district courts usually use Tok Pisin or Hiri Motu. Village courts may use a local language. Most national newspapers use English, although one national weekly newspaper, Wantok, uses Tok Pisin. National radio and television use English and Tok Pisin, with a small amount of Hiri Motu. Provincial radio uses a mixture of these languages, in addition to local ones.[48]:147 Many information campaigns and advertisements use Tok Pisin.[citation needed] Over time, Tok Pisin has continued to spread as the most common language, displacing Hiri Motu,[48]:146 including in the former Hiri Motu-dominated capital, Port Moresby.[52] The only area where Tok Pisin is not the prevalent lingua franca is the southern region of Papua, where people often use the third official language, Hiri Motu. Motu spoken as the indigenous language in outlying villages surrounding the capital.[citation needed]
Most provinces do not have a dominant local language, although exceptions exist. Enga Province is dominated by Enga language speakers, however it adopted Tok Pisin as its official language in 1976. East New Britain Province is dominated by Tolai speakers, which has caused issues with minority speakers of the Baining languages or Sulka.[48]:147–148 However, in general language has not been a cause for conflict, with conflicts occurring between communities speaking the same language, and regional identities incorporating many different linguistic communities.[48]:153 English and Tok Pisin are generally seen as neutral languages, while local languages are considered culturally valuable and multilingualism is officially encouraged.[48]:154
The use of almost all local languages, as well as Hiri Motu, is declining.[48]:148 Some local languages have fewer than 100 speakers.[48]:135 The use of local languages is encouraged by government, which encourages teaching in local languages before shifting to a more national language. As of April 2000, 837 languages had educational support, with few problems reported from schools covering two different local language communities. However, in 2013 education was shifted back towards English to try and improve low English literacy rates.[48]:151–152
Tuition fees were abolished in 2012, leading to an increase in educational attendance, but results were mixed and the fees were partially reintroduced in 2019.[15]:170,208 In the late 2010s, the share of the male population considered to be without education was around 32%, while for the female population it was 40%.[15]:171
The Human Rights Measurement Initiative reports that Papua New Guinea is achieving 68.5% of what should be possible for the right to education, based on their level of income.[58]
As of 2019, life expectancy in Papua New Guinea at birth was 63 years for men and 67 for women.[59] Government expenditure health in 2014 accounted for 9.5% of total government spending, with total health expenditure equating to 4.3% of GDP.[59] There were five physicians per 100,000 people in the early 2000s.[60] The 2008 maternal mortality rate per 100,000 births for Papua New Guinea was 250. This is compared with 270 in 2005 and 340 in 1990. The under-5 mortality rate, per 1,000 births is 69 and the neonatal mortality as a percentage of under-5s' mortality is 37. In Papua New Guinea, the number of midwives per 1,000 live births is 1 and the lifetime risk of death for pregnant women is 1 in 94.[61] These national improvements in child mortality mostly reflect improvement in rural areas, with little change or slight worsening in some urban areas.[15]:174 As of 2016, the total fertility rate was 4.4.[15]:177
Health infrastructure overall is poorly developed. There is a high incidence of HIV/AIDS, and there have been outbreaks of diseases such as cholera and tuberculosis.[25]:169 Vaccine coverage in 2016 was 35%, with 24% of children having no vaccines.[15]:175
The Human Rights Measurement Initiative finds that Papua New Guinea is achieving 71.9% of what should be possible for the right to health, based on their level of income.[62]
↑"Papua New Guinea". International Religious Freedom Report 2003. US Department of State. Archived from the original on 1 September 2019. Retrieved 22 May 2019.
This page is based on this Wikipedia article Text is available under the CC BY-SA 4.0 license; additional terms may apply. Images, videos and audio are available under their respective licenses.