A logic gate is a device that performs a Boolean function, a logical operation performed on one or more binary inputs that produces a single binary output. Depending on the context, the term may refer to an ideal logic gate, one that has, for instance, zero rise time and unlimited fan-out, or it may refer to a non-ideal physical device.
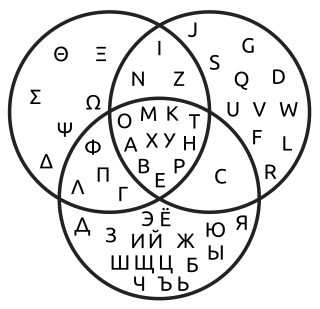
A Venn diagram is a widely used diagram style that shows the logical relation between sets, popularized by John Venn (1834–1923) in the 1880s. The diagrams are used to teach elementary set theory, and to illustrate simple set relationships in probability, logic, statistics, linguistics and computer science. A Venn diagram uses simple closed curves drawn on a plane to represent sets. Very often, these curves are circles or ellipses.

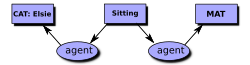
A conceptual graph (CG) is a formalism for knowledge representation. In the first published paper on CGs, John F. Sowa used them to represent the conceptual schemas used in database systems. The first book on CGs applied them to a wide range of topics in artificial intelligence, computer science, and cognitive science.
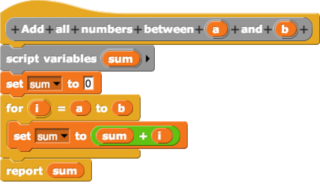
In computing, a visual programming language, also known as diagrammatic programming, graphical programming or block coding, is a programming language that lets users create programs by manipulating program elements graphically rather than by specifying them textually. A VPL allows programming with visual expressions, spatial arrangements of text and graphic symbols, used either as elements of syntax or secondary notation. For example, many VPLs are based on the idea of "boxes and arrows", where boxes or other screen objects are treated as entities, connected by arrows, lines or arcs which represent relations. VPLs are generally the basis of Low-code development platforms.
In computer science, a binary decision diagram (BDD) or branching program is a data structure that is used to represent a Boolean function. On a more abstract level, BDDs can be considered as a compressed representation of sets or relations. Unlike other compressed representations, operations are performed directly on the compressed representation, i.e. without decompression.
A diagram is a symbolic representation of information using visualization techniques. Diagrams have been used since prehistoric times on walls of caves, but became more prevalent during the Enlightenment. Sometimes, the technique uses a three-dimensional visualization which is then projected onto a two-dimensional surface. The word graph is sometimes used as a synonym for diagram.
Laws of Form is a book by G. Spencer-Brown, published in 1969, that straddles the boundary between mathematics and philosophy. LoF describes three distinct logical systems:
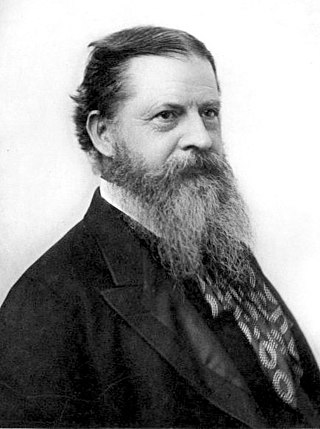
An existential graph is a type of diagrammatic or visual notation for logical expressions, created by Charles Sanders Peirce, who wrote on graphical logic as early as 1882, and continued to develop the method until his death in 1914. They include both a separate graphical notation for logical statements and a logical calculus, a formal system of rules of inference that can be used to derive theorems.
The Latin term characteristica universalis, commonly interpreted as universal characteristic, or universal character in English, is a universal and formal language imagined by Gottfried Leibniz able to express mathematical, scientific, and metaphysical concepts. Leibniz thus hoped to create a language usable within the framework of a universal logical calculation or calculus ratiocinator.

An inquiry is any process that has the aim of augmenting knowledge, resolving doubt, or solving a problem. A theory of inquiry is an account of the various types of inquiry and a treatment of the ways that each type of inquiry achieves its aim.
String diagrams are a formal graphical language for representing morphisms in monoidal categories, or more generally 2-cells in 2-categories. They are a prominent tool in applied category theory. When interpreted in the monoidal category of vector spaces and linear maps with the tensor product, string diagrams are called tensor networks or Penrose graphical notation. This has led to the development of categorical quantum mechanics where the axioms of quantum theory are expressed in the language of monoidal categories.
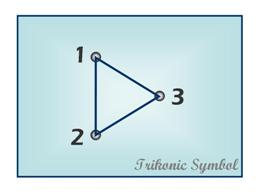
Trikonic, is a proposed method of philosophical analysis-synthesis. It is based on Charles Sanders Peirce's "trichotomic", which he described in 1888 as "the art of making three-fold divisions". Trikonic, or "diagrammatic trichotomic", was developed by Gary Richmond in 2005.
Logic is the formal science of using reason and is considered a branch of both philosophy and mathematics and to a lesser extent computer science. Logic investigates and classifies the structure of statements and arguments, both through the study of formal systems of inference and the study of arguments in natural language. The scope of logic can therefore be very large, ranging from core topics such as the study of fallacies and paradoxes, to specialized analyses of reasoning such as probability, correct reasoning, and arguments involving causality. One of the aims of logic is to identify the correct and incorrect inferences. Logicians study the criteria for the evaluation of arguments.
In mathematical logic, algebraic logic is the reasoning obtained by manipulating equations with free variables.
Diagrammatology is the academic study of diagrams. It studies fundamental role played by the diagram in the communication and creation of knowledge. Diagrammatology is not only an interdisciplinary subject, but pan-historical and cross-cultural.
In logic, a quantifier is an operator that specifies how many individuals in the domain of discourse satisfy an open formula. For instance, the universal quantifier in the first order formula expresses that everything in the domain satisfies the property denoted by . On the other hand, the existential quantifier in the formula expresses that there exists something in the domain which satisfies that property. A formula where a quantifier takes widest scope is called a quantified formula. A quantified formula must contain a bound variable and a subformula specifying a property of the referent of that variable.
In mathematics and mathematical logic, Boolean algebra is a branch of algebra. It differs from elementary algebra in two ways. First, the values of the variables are the truth values true and false, usually denoted 1 and 0, whereas in elementary algebra the values of the variables are numbers. Second, Boolean algebra uses logical operators such as conjunction (and) denoted as ∧, disjunction (or) denoted as ∨, and negation (not) denoted as ¬. Elementary algebra, on the other hand, uses arithmetic operators such as addition, multiplication, subtraction, and division. Boolean algebra is therefore a formal way of describing logical operations in the same way that elementary algebra describes numerical operations.
Sun-Joo Shin is a Korean-American philosopher known for her work on diagrammatic reasoning in mathematical logic, including the validity of reasoning using Venn diagrams, the existential graphs of Charles Sanders Peirce, and the philosophical distinction between diagrammatic and symbolic reasoning. She is a professor of philosophy at Yale University.