General elections were held in the Netherlands on 17 May 1946, the first after World War II. The Catholic People's Party, a continuation of the pre-war Roman Catholic State Party, remained the largest party in the House of Representatives, winning 32 of the 100 seats.
General elections were held in the Netherlands on 25 June 1952. The Catholic People's Party and the Labour Party both won 30 of the 100 seats in the House of Representatives. It was the first time since 1913 that the Catholic People's Party and its predecessors had not received a plurality of the vote.
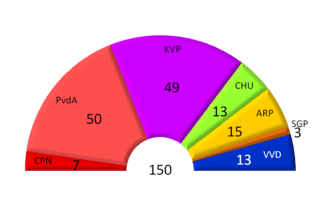
General elections were held in the Netherlands on 13 June 1956. For the first time, the Labour Party (PvdA) emerged as the largest party, winning 50 of the 150 seats in the House of Representatives.
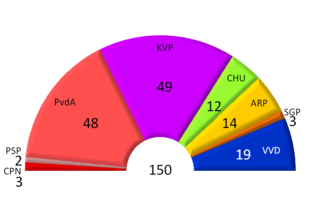
General elections were held in the Netherlands on 12 March 1959. The Catholic People's Party emerged as the largest party, winning 49 of the 150 seats in the House of Representatives.

General elections were held in the Netherlands on 15 May 1963. The Catholic People's Party (KVP) remained the largest party, winning 50 of the 150 seats in the House of Representatives.

General elections were held in the Netherlands on 15 February 1967. The Catholic People's Party (KVP) remained the largest party, winning 42 of the 150 seats in the House of Representatives.

Early general elections were held in the Netherlands on 29 November 1972. The Labour Party (PvdA) remained the largest party, winning 43 of the 150 seats in the House of Representatives.

General elections were held in the Netherlands on 25 May 1977. The Labour Party remained the largest party, winning 53 of the 150 seats in the House of Representatives. Following the election, it took 208 days of negotiations to form a new government. This was a European record for longest government formation that stood until after the 2010 Belgian general election. The Christian Democratic Appeal was formed by the Anti-Revolutionary Party (ARP), Christian Historical Union (CHU) and the Catholic People's Party (KVP) in 1976. The first joint party leader was a member of the KVP, Dries van Agt.
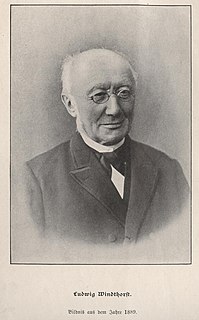
Federal elections were held in Germany on 20 February 1890. The Centre Party regained its position as the largest party in the Reichstag by winning 106 of the 397 seats, whilst the National Liberal Party, formerly the largest party, was reduced to 42 seats. Despite receiving the most votes, the Social Democratic Party won only 35 seats. Voter turnout was 71.5%.

General elections were held in Belgium on 17 February 1946. The result was a victory for the Christian Social Party, which won 92 of the 202 seats in the Chamber of Representatives and 51 of the 101 seats in the Senate. Voter turnout was 90.3%.

General elections were held in Belgium on 4 June 1950. The result was a victory for the Christian Social Party, which won 108 of the 212 seats in the Chamber of Representatives and 54 of the 106 seats in the Senate. Voter turnout was 92.6%. This election was the last one in Belgian history were a single party achieved an absolute majority. Elections for the nine provincial councils were also held.

General elections were held in Belgium on 11 April 1954. The dominant Christian Social Party won 95 of the 212 seats in the Chamber of Representatives and 49 of the 106 seats in the Senate. Voter turnout was 93.2%. Elections for the nine provincial councils were also held.

General elections were held in Belgium on 1 June 1958. The result was a victory for the Christian Social Party, which won 104 of the 212 seats in the Chamber of Representatives and 53 of the 106 seats in the Senate. Voter turnout was 93.6% in the Chamber election and 93.7% in the Senate election. Elections for the nine provincial councils were also held.

General elections were held in Belgium on 16 November 1919. Although the Belgian Labour Party received the most votes in the Chamber of Representatives elections, the Catholic Party remained the largest party in both the Chamber and the Senate. Voter turnout was 88.5% in the Chamber elections.

Full general elections were held in Belgium on 14 October 1894, with run-off elections held on 21 October 1894.

Partial legislative elections were held in Belgium on 5 and 12 July 1896. Under the alternating system, elections were held in only five out of the nine provinces: Antwerp, Brabant, Luxembourg, Namur and West Flanders. Thus, only 77 seats out of the 152 seats in the Chamber of Representatives were up for election. The Catholic Party retained their absolute majority.
Partial general elections were held in Belgium on 25 May 1902. The result was a victory for the Catholic Party, which won 54 of the 85 seats up for election in the Chamber of Representatives. Voter turnout was 95.7%.

General elections were held in Belgium on 26 May 1929. The result was a victory for the Catholic Party, which won 71 of the 187 seats in the Chamber of Representatives. Voter turnout was 94.0%.

General elections were held in Liechtenstein on 11 March 1918, with a second round on 18 March. They were the first elections held in the country contested by political parties, as the Christian-Social People's Party and Progressive Citizens' Party had been founded that year. The Progressive Citizens' Party emerged as the largest in the Landtag, winning seven of the 12 elected seats.
The People's Party was a political party in Bulgaria between 1894 and 1920.


