General elections were held in the Netherlands on 17 May 1946, the first after World War II. The Catholic People's Party, a continuation of the pre-war Roman Catholic State Party, remained the largest party in the House of Representatives, winning 32 of the 100 seats.
General elections were held in the Netherlands on 7 July 1948. The Catholic People's Party remained the largest party in the House of Representatives, winning 32 of the 100 seats.
General elections were held in the Netherlands on 13 June 1956. For the first time, the Labour Party (PvdA) emerged as the largest party, winning 50 of the 150 seats in the House of Representatives.

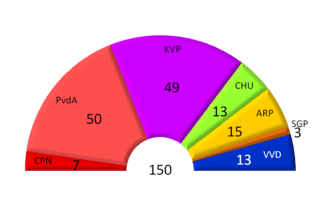
General elections were held in the Netherlands on 15 May 1963. The Catholic People's Party (KVP) remained the largest party, winning 50 of the 150 seats in the House of Representatives.

General elections were held in the Netherlands on 15 February 1967. The Catholic People's Party (KVP) remained the largest party, winning 42 of the 150 seats in the House of Representatives.

General elections were held in the Netherlands on 28 April 1971. The Labour Party (PvdA) emerged as the largest party, winning 39 of the 150 seats in the House of Representatives. The elections were the first without compulsory voting, causing a sharp fall in voter turnout, down to 79.1% from 94.9% in the 1967 elections. Barend Biesheuvel of the Anti-Revolutionary Party (ARP) became Prime Minister, leading the first Biesheuvel cabinet.

Early general elections were held in the Netherlands on 29 November 1972. The Labour Party (PvdA) remained the largest party, winning 43 of the 150 seats in the House of Representatives.

General elections were held in the Netherlands on 25 May 1977. The Labour Party remained the largest party, winning 53 of the 150 seats in the House of Representatives. Following the election, it took 208 days of negotiations to form a new government. This was a European record for longest government formation that stood until after the 2010 Belgian general election. The Christian Democratic Appeal was formed by the Anti-Revolutionary Party (ARP), Christian Historical Union (CHU) and the Catholic People's Party (KVP) in 1976. The first joint party leader was a member of the KVP, Dries van Agt.

General elections were held in the Netherlands on 26 May 1981. The Christian Democratic Appeal (CDA) emerged as the largest party, winning 48 of the 150 seats in the House of Representatives.

Early general elections were held in the Netherlands on 8 September 1982. The Labour Party emerged as the largest party, winning 47 of the 150 seats in the House of Representatives.

General elections were held in the Netherlands on 3 May 1994. The Labour Party emerged as the largest party, winning 37 of the 150 seats in the House of Representatives. The election resulted in significant losses for both the Labour Party and the Christian Democratic Appeal. The two liberal parties, People's Party for Freedom and Democracy and Democrats 66 made large gains, whilst two pro-elderly parties and the Socialist Party all passed the electoral threshold to win seats.
Parliamentary elections were held in Norway on 13 and 14 September 1981. The Labour Party remained the largest party in the Storting, winning 66 of the 155 seats. The Conservative Party made the strongest gains and formed a government on its own. In 1983 a majority coalition government with the Christian People's Party and the Center Party was established.
Parliamentary elections were held in Norway on 12 and 13 September 1965. The Labour Party remained the largest party, winning 68 of the 150 seats. However, the four non-socialist parties succeeded in winning a majority between them and forming a government. Per Borten, the leader of the Centre Party, became Prime Minister.
Parliamentary elections were held in Norway on 11 September 1961. The result was a victory for the Labour Party, which won 74 of the 150 seats in the Storting. Although it lost its absolute majority, the Labour Party was able to continue in government.

Parliamentary elections were held in Norway on 16 October 1933. The result was a victory for the Labour Party, which won 69 of the 150 seats in the Storting.

General elections were held in Belgium on 17 February 1946. The result was a victory for the Christian Social Party, which won 92 of the 202 seats in the Chamber of Representatives and 51 of the 101 seats in the Senate. Voter turnout was 90.3%.

General elections were held in Belgium on 16 November 1919. Although the Belgian Labour Party received the most votes in the Chamber of Representatives elections, the Catholic Party remained the largest party in both the Chamber and the Senate. Voter turnout was 88.5% in the Chamber elections.

General elections were held in Malta between 2 and 4 September 1950. Following the Labour Party splitting into the Malta Labour Party and the Malta Workers Party, the Nationalist Party emerged as the largest party, winning 12 of the 40 seats.

Full general elections were held in Belgium on 14 October 1894, with run-off elections held on 21 October 1894.

General elections were held in Belgium on 24 May 1936. The result was a victory for the Belgian Labour Party, which won 70 of the 202 seats in the Chamber of Representatives and 39 of the 101 seats in the Senate. Voter turnout was 94.7%.


