This article needs additional or more specific categories .(March 2025) |
Edmonds | |
|---|---|
 Aerial view of Edmonds in 2025 | |
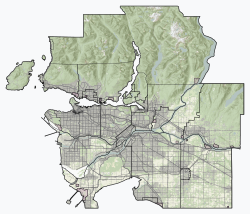 Edmonds Location of Edmonds within Metro Vancouver | |
| Coordinates: 49°13′10″N122°57′00″W / 49.21944°N 122.95000°W | |
| Country | Canada |
| Province | British Columbia |
| Region | Lower Mainland |
| Regional District | Metro Vancouver |
| City | Burnaby |
| Government | |
| • Mayor | Mike Hurley |
| • MP (Fed.) | Jagmeet Singh (NDP) |
| • MP (Fed.) | Peter Julian (NDP) |
| • MLA (Prov.) | Raj Chouhan (BC NDP) |
| Elevation | 100 m (330 ft) |
| Population | |
• Total | 39,656 |
| Time zone | UTC−8 (PST) |
| • Summer (DST) | UTC−7 (PDT) |
Edmonds is a neighbourhood in the southeast of Burnaby, British Columbia, Canada. It is one of the city's four officially designated town centres. [7]
Contents
The area is served by the Expo Line of the SkyTrain via Edmonds station.
The neighbourhood is named after businessman and politician Henry Valentine Edmonds, who owned real estate in the area and was active in local affairs. [8]