This is a list of electoral results for the Division of Cook in Australian federal elections from the division's creation in 1906 until its abolition in 1955. For the later division of Cook, see Electoral results for the Division of Cook.
Member | Party | Term | |
---|---|---|---|
James Catts | Labor | 1906–1922 | |
Majority Labor | 1922–1922 | ||
Edward Riley | Labor | 1922–1934 | |
Jock Garden | Labor (NSW) | 1934–1936 | |
Labor | 1936–1937 | ||
Tom Sheehan | Labor | 1937–1940 | |
Labor (N-C) | 1940–1941 | ||
Labor | 1941–1955 | ||
Jim Cope | Labor | 1955–1955 |
Party | Candidate | Votes | % | ±% | |
---|---|---|---|---|---|
Labor | Jim Cope | 21,411 | 86.8 | +3.4 | |
Independent | John Somerville-Smith | 3,248 | 13.2 | +13.2 | |
Total formal votes | 24,659 | 96.8 | |||
Informal votes | 814 | 3.2 | |||
Turnout | 25,473 | 76.0 | |||
Labor hold | Swing | −3.6 | |||
Party | Candidate | Votes | % | ±% | |
---|---|---|---|---|---|
Labor | Tom Sheehan | 26,841 | 83.4 | +5.3 | |
Independent | Percy Staines | 2,868 | 8.9 | +8.9 | |
Communist | Harry Hatfield | 2,465 | 7.7 | −0.7 | |
Total formal votes | 32,174 | 97.4 | |||
Informal votes | 851 | 2.6 | |||
Turnout | 33,025 | 94.9 | |||
Two-party-preferred result | |||||
Labor | Tom Sheehan | 90.4 | +4.7 | ||
Independent | Percy Staines | 9.6 | +9.6 | ||
Labor hold | Swing | +4.7 | |||
Party | Candidate | Votes | % | ±% | |
---|---|---|---|---|---|
Labor | Tom Sheehan | 27,637 | 78.1 | +3.1 | |
Liberal | Roy Hatfield | 4,790 | 13.5 | −2.8 | |
Communist | Harry Hatfield | 2,976 | 8.4 | +4.9 | |
Total formal votes | 35,403 | 97.3 | |||
Informal votes | 965 | 2.7 | |||
Turnout | 36,368 | 94.4 | |||
Two-party-preferred result | |||||
Labor | Tom Sheehan | 85.7 | +3.6 | ||
Liberal | Roy Hatfield | 34.3 | −3.6 | ||
Labor hold | Swing | +3.6 | |||
Party | Candidate | Votes | % | ±% | |
---|---|---|---|---|---|
Labor | Tom Sheehan | 27,485 | 75.0 | +2.7 | |
Liberal | Gerald Davis | 5,970 | 16.3 | +3.9 | |
Lang Labor | John Eldridge | 1,920 | 5.2 | −9.5 | |
Communist | Mervyn Pidcock | 1,276 | 3.5 | −2.9 | |
Total formal votes | 36,651 | 96.9 | |||
Informal votes | 1,174 | 3.1 | |||
Turnout | 37,825 | 95.9 | |||
Two-party-preferred result | |||||
Labor | Tom Sheehan | 82.1 | +8.7 | ||
Liberal | Gerald Davis | 17.9 | +17.9 | ||
Labor hold | Swing | +8.7 | |||
Party | Candidate | Votes | % | ±% | |
---|---|---|---|---|---|
Labor | Tom Sheehan | 38,407 | 65.1 | −3.8 | |
Lang Labor | Arthur Brittain | 8,423 | 14.3 | +14.3 | |
Liberal | Frank Preacher | 7,306 | 12.4 | +12.4 | |
Communist | Lance Sharkey | 4,341 | 7.4 | +7.4 | |
Independent | Frederick Fairbrother | 559 | 0.9 | +0.9 | |
Total formal votes | 59,036 | 96.0 | |||
Informal votes | 2,441 | 4.0 | |||
Turnout | 61,477 | 95.0 | |||
Two-party-preferred result | |||||
Labor | Tom Sheehan | 73.4 | −3.0 | ||
Lang Labor | Arthur Brittain | 26.6 | +26.6 | ||
Labor hold | Swing | −3.0 | |||
Party | Candidate | Votes | % | ±% | |
---|---|---|---|---|---|
Labor | Tom Sheehan | 39,653 | 68.9 | +36.3 | |
State Labor | Sid Conway | 12,131 | 21.1 | +21.1 | |
One Parliament | Albert Jones | 3,238 | 5.6 | +5.6 | |
Protestant Labor | Cyril Glassop | 2,557 | 4.4 | +4.4 | |
Total formal votes | 57,579 | 96.7 | |||
Informal votes | 1,986 | 3.3 | |||
Turnout | 59,565 | 98.0 | |||
Two-party-preferred result | |||||
Labor | Tom Sheehan | 76.4 | +40.0 | ||
State Labor | Sid Conway | 23.6 | +23.6 | ||
Labor gain from Labor (N-C) | Swing | +40.0 | |||
Party | Candidate | Votes | % | ±% | |
---|---|---|---|---|---|
Labor (N-C) | Tom Sheehan | 31,625 | 58.4 | +58.4 | |
Labor | Jock Garden | 17,634 | 32.6 | −37.7 | |
Independent Labor | Cyril Glassop | 4,901 | 9.0 | +9.0 | |
Total formal votes | 54,160 | 96.4 | |||
Informal votes | 2,041 | 3.6 | |||
Turnout | 56,201 | 95.5 | |||
Two-party-preferred result | |||||
Labor (N-C) | Tom Sheehan | 63.6 | +63.6 | ||
Labor | Jock Garden | 36.4 | −33.9 | ||
Labor (N-C) gain from Labor | Swing | +33.9 | |||
Party | Candidate | Votes | % | ±% | |
---|---|---|---|---|---|
Labor | Tom Sheehan | 38,201 | 70.3 | +45.2 | |
Independent Labor | Cyril Glassop | 16,125 | 29.7 | +29.7 | |
Total formal votes | 56,642 | 95.9 | |||
Informal votes | 2,316 | 4.1 | |||
Turnout | 56,642 | 97.0 | |||
Labor gain from Labor (NSW) | Swing | +78.6 | |||
Party | Candidate | Votes | % | ±% | |
---|---|---|---|---|---|
Labor (NSW) | Jock Garden | 27,020 | 52.2 | +3.0 | |
Labor | Edward Riley | 12,993 | 25.1 | −1.8 | |
United Australia | Francis Donnan | 8,029 | 15.5 | −7.7 | |
Social Credit | Florence Cochrane | 2,409 | 4.7 | +4.7 | |
Communist | Tom Wright | 1,315 | 2.5 | +2.5 | |
Total formal votes | 51,766 | 94.4 | |||
Informal votes | 3,092 | 5.6 | |||
Turnout | 54,858 | 96.1 | |||
Two-party-preferred result | |||||
Labor (NSW) | Jock Garden | 58.3 | +6.3 | ||
Labor | Edward Riley | 41.7 | −6.3 | ||
Labor (NSW) hold | Swing | +6.3 | |||
Party | Candidate | Votes | % | ±% | |
---|---|---|---|---|---|
Labor (NSW) | Jock Garden | 19,352 | 47.9 | +47.9 | |
Labor | Edward Riley | 12,531 | 31.0 | −53.2 | |
United Australia | Charles Robinson | 7,986 | 19.8 | +4.0 | |
Communist | Tom Wright | 536 | 1.3 | +1.3 | |
Total formal votes | 40,405 | 95.1 | |||
Informal votes | 2,063 | 4.9 | |||
Turnout | 42,468 | 96.4 | |||
Two-party-preferred result | |||||
Labor | Edward Riley | 20,560 | 50.9 | −33.3 | |
Labor (NSW) | Jock Garden | 19,845 | 49.1 | +49.1 | |
Labor hold | Swing | −33.3 | |||
Party | Candidate | Votes | % | ±% | |
---|---|---|---|---|---|
Labor | Edward Riley | 34,221 | 84.2 | +8.7 | |
Nationalist | William Pickup | 6,409 | 15.8 | −8.7 | |
Total formal votes | 40,630 | 97.0 | |||
Informal votes | 1,263 | 3.0 | |||
Turnout | 41,893 | 95.3 | |||
Labor hold | Swing | +8.7 | |||
Party | Candidate | Votes | % | ±% | |
---|---|---|---|---|---|
Labor | Edward Riley | 28,326 | 75.5 | +7.7 | |
Nationalist | Humphrey Earl | 9,197 | 24.5 | −7.7 | |
Total formal votes | 37,523 | 94.5 | |||
Informal votes | 2,202 | 5.5 | |||
Turnout | 39,725 | 95.1 | |||
Labor hold | Swing | +7.7 | |||
Party | Candidate | Votes | % | ±% | |
---|---|---|---|---|---|
Labor | Edward Riley | 25,764 | 67.8 | +2.8 | |
Nationalist | Arthur Philip | 12,229 | 32.2 | +11.1 | |
Total formal votes | 37,993 | 98.0 | |||
Informal votes | 764 | 2.0 | |||
Turnout | 38,757 | 92.2 | |||
Labor hold | Swing | −6.9 | |||
Party | Candidate | Votes | % | ±% | |
---|---|---|---|---|---|
Labor | Edward Riley | 14,644 | 65.0 | +2.7 | |
Nationalist | William Pritchard | 4,749 | 21.1 | −9.9 | |
Majority Labor | James Catts | 3,122 | 13.9 | +13.9 | |
Total formal votes | 22,515 | 95.4 | |||
Informal votes | 1,085 | 4.6 | |||
Turnout | 23,600 | 57.6 | |||
Two-party-preferred result | |||||
Labor | Edward Riley | 74.9 | +9.0 | ||
Nationalist | William Pritchard | 25.1 | −9.0 | ||
Labor hold | Swing | +9.0 | |||
Party | Candidate | Votes | % | ±% | |
---|---|---|---|---|---|
Labor | James Catts | 14,559 | 62.3 | −2.1 | |
Nationalist | George Holt | 7,248 | 31.0 | −4.6 | |
Ind. Socialist Labor | William McCristal | 1,562 | 6.7 | +6.7 | |
Total formal votes | 23,369 | 90.2 | |||
Informal votes | 2,540 | 9.8 | |||
Turnout | 25,909 | 66.1 | |||
Two-party-preferred result | |||||
Labor | James Catts | 65.7 | +1.3 | ||
Nationalist | George Holt | 34.3 | −1.3 | ||
Labor hold | Swing | +1.3 | |||
Party | Candidate | Votes | % | ±% | |
---|---|---|---|---|---|
Labor | James Catts | 18,101 | 64.4 | +3.7 | |
Nationalist | Richard Sleath | 9,985 | 35.6 | −1.8 | |
Total formal votes | 28,086 | 96.7 | |||
Informal votes | 950 | 3.3 | |||
Turnout | 29,036 | 70.7 | |||
Labor hold | Swing | +2.7 | |||
Party | Candidate | Votes | % | ±% | |
---|---|---|---|---|---|
Labor | James Catts | 16,568 | 60.7 | +2.0 | |
Liberal | Stanley Yarrington | 10,197 | 37.4 | −1.6 | |
Socialist | Emily Paul | 509 | 1.9 | −0.3 | |
Total formal votes | 27,274 | 97.7 | |||
Informal votes | 629 | 2.3 | |||
Turnout | 27,903 | 60.6 | |||
Labor hold | Swing | +1.8 | |||
Party | Candidate | Votes | % | ±% | |
---|---|---|---|---|---|
Labor | James Catts | 17,271 | 58.7 | −2.3 | |
Liberal | David Doull | 11,473 | 39.0 | +0.0 | |
Socialist | Tom Walsh | 661 | 2.2 | +2.2 | |
Total formal votes | 29,405 | 96.9 | |||
Informal votes | 942 | 3.1 | |||
Turnout | 30,347 | 71.2 | |||
Labor hold | Swing | −1.1 | |||
Party | Candidate | Votes | % | ±% | |
---|---|---|---|---|---|
Labour | James Catts | 14,021 | 64.1 | +11.1 | |
Liberal | William Clegg | 7,856 | 35.9 | −11.1 | |
Total formal votes | 21,877 | 98.6 | |||
Informal votes | 319 | 1.4 | |||
Turnout | 22,196 | 65.7 | |||
Labour hold | Swing | +11.1 | |||
Party | Candidate | Votes | % | ±% | |
---|---|---|---|---|---|
Labour | James Catts | 8,563 | 53.0 | ||
Anti-Socialist | John Hindle | 7,591 | 47.0 | ||
Total formal votes | 16,154 | 97.2 | |||
Informal votes | 470 | 2.8 | |||
Turnout | 14,725 | 52.5 | |||
Labour notional hold | Swing | ||||
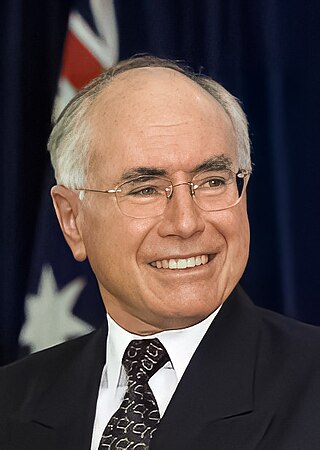
The 2001 Australian federal election was held in Australia on 10 November 2001. All 150 seats in the House of Representatives and 40 seats in the 76-member Senate were up for election. The incumbent Liberal Party of Australia led by Prime Minister of Australia John Howard and coalition partner the National Party of Australia led by John Anderson defeated the opposition Australian Labor Party led by Kim Beazley. Future Opposition Leader Peter Dutton entered parliament at this election. As of 2023 this was the most recent federal election to have a rematch in 11 years, and the most recent repeated election when Howard beat Beazley just 3 years earlier and until 2013 to have both major party leaders running in previous federal elections as major party leaders when in 2013, and the last for both major party leaders to appear in consecutive federal elections in 24 years.
The Division of Cook is an Australian electoral division in the State of New South Wales.
The Division of Canberra is an Australian electoral division in the Australian Capital Territory. It is named for the city of Canberra, Australia's national capital, and includes all of central Canberra, Kowen, Majura, as well as part of Weston Creek, Woden Valley, Molonglo Valley, Belconnen, and Jerrabomberra. It is currently held by Alicia Payne of the Labor Party.
The Division of Maranoa is an Australian electoral division in Queensland.
The Division of Hughes is an Australian electoral division in the state of New South Wales.
The Division of Parramatta is an Australian electoral division in the state of New South Wales. The division was created in 1900 and was one of the original 65 divisions contested at the first federal election. It is named for the locality of Parramatta. The name Parramatta has been sourced to an Aboriginal word for the area. The Darug people had lived in the area for many generations, and regarded the area as a food bowl, rich in food from the river and forests. They called the area Baramada or Burramatta ("Parramatta") which means "the place where the eels lie down".
The Division of Lalor is an Australian Electoral Division in the state of Victoria. Located in the south-western suburbs of Melbourne, it includes the south-western hub of Werribee as well as the suburbs of Hoppers Crossing, Tarneit, Truganina, Wyndham Vale and part of Point Cook.
The Division of Mitchell is an Australian electoral division in the state of New South Wales.
Croydon Park is a suburb in the Inner West of Sydney, in the state of New South Wales, Australia. Croydon Park is 10 kilometres south-west of the Sydney central business district and is divided between the local government areas of the City of Canterbury-Bankstown, Municipality of Burwood and Inner West Council. Croydon is a separate suburb, to the north.
In Australia, a redistribution is the process of redrawing the boundaries of electoral divisions for the House of Representatives arising from changes in population and changes in the number of representatives. There is no redistribution for the Senate as each State constitutes a division, though with multiple members. The Australian Electoral Commission (AEC), an independent statutory authority, oversees the apportionment and redistribution process for federal divisions, taking into account a number of factors. Politicians, political parties and the public may make submissions to the AEC on proposed new boundaries, but any interference with their deliberations is considered a serious offence.
This is a list of electoral results for the Division of Cook in Australian federal elections from the electorate's creation in 1969 until the present.
This is a list of electoral division results for the Australian 1954 federal election.
This is a list of electoral division results for the Australian 1946 federal election.
This is a list of electoral division results for the Australian 1949 federal election.
This is a list of electoral division results for the Australian 1951 federal election.
This is a list of electoral division results for the Australian 1969 federal election.
This is a list of electoral division results for the Australian 1972 federal election.
This is a list of electoral division results for the Australian 1977 federal election.
This is a list of electoral division results for the Australian 1980 federal election.
This is a list of electoral division results for the Australian 1983 federal election.