This is a list of electoral results for the electoral district of Cooroora in Queensland state elections.
Member | Party | Term | |
---|---|---|---|
Harry Walker | Ministerialist | 1912-1915 | |
Liberal | 1915-1918 | ||
National | 1918-1920 | ||
Country | 1920-1925 | ||
CPNP | 1925-1936 | ||
Country | 1936-1947 | ||
David Low | Country | 1947-1974 | |
Gordon Simpson | National | 1974-1989 | |
Ray Barber | Labor | 1989-1992 | |
The results for the 1989 election were: [1]
Party | Candidate | Votes | % | ± | |
---|---|---|---|---|---|
Labor | Ray Barber | 11,857 | 48.1 | +16.8 | |
National | Robin Priebe | 5,629 | 22.8 | -26.6 | |
Liberal | Allen Low | 5,613 | 22.8 | +8.2 | |
Independent | Joseph Roach | 1,561 | 6.3 | +6.3 | |
Total formal votes | 24,660 | 97.2 | -1.3 | ||
Informal votes | 702 | 2.8 | +1.3 | ||
Turnout | 25,362 | 89.3 | -0.0 | ||
Two-party-preferred result | |||||
Labor | Ray Barber | 12,584 | 51.0 | +12.2 | |
Liberal | Allen Low | 12,076 | 49.0 | +49.0 | |
Labor gain from National | Swing | +12.2 |
Party | Candidate | Votes | % | ± | |
---|---|---|---|---|---|
National | Gordon Simpson | 9,163 | 49.4 | -8.1 | |
Labor | Brian Payler | 5,799 | 31.3 | -2.0 | |
Liberal | Wehl Wansley | 2,706 | 14.6 | +14.6 | |
Democrats | John Boultbee | 871 | 4.7 | -2.4 | |
Total formal votes | 18,539 | 98.5 | |||
Informal votes | 277 | 1.5 | |||
Turnout | 18,816 | 89.3 | |||
Two-party-preferred result | |||||
National | Gordon Simpson | 11,242 | 60.6 | -1.0 | |
Labor | Brian Payler | 7,297 | 39.4 | +1.0 | |
National hold | Swing | -1.0 | |||
Party | Candidate | Votes | % | ± | |
---|---|---|---|---|---|
National | Gordon Simpson | 13,478 | 57.5 | +3.4 | |
Labor | Gordon Nuttall | 7,805 | 33.3 | +6.2 | |
Democrats | T. Roth | 1,655 | 7.1 | +7.1 | |
Independent | Stanley Carlile | 482 | 2.1 | +2.1 | |
Total formal votes | 23,420 | 98.6 | 0.0 | ||
Informal votes | 339 | 1.4 | 0.0 | ||
Turnout | 23,759 | 90.7 | +1.8 | ||
Two-party-preferred result | |||||
National | Gordon Simpson | 14,547 | 62.1 | -4.3 | |
Labor | Gordon Nuttall | 8,873 | 37.9 | +4.3 | |
National hold | Swing | -4.3 | |||
Party | Candidate | Votes | % | ± | |
---|---|---|---|---|---|
National | Gordon Simpson | 10,457 | 54.2 | +2.5 | |
Labor | Sydney Appleby | 5,230 | 27.1 | -2.1 | |
Liberal | John Barbeler | 2,821 | 14.6 | -4.4 | |
Independent | Donald Sime | 798 | 4.1 | +4.1 | |
Total formal votes | 19,306 | 98.6 | -0.5 | ||
Informal votes | 280 | 1.4 | +0.5 | ||
Turnout | 19,586 | 88.9 | -3.1 | ||
Two-party-preferred result | |||||
National | Gordon Simpson | 12,821 | 66.4 | -1.7 | |
Labor | Sydney Appleby | 6,485 | 33.6 | +1.7 | |
National hold | Swing | -1.7 | |||
Party | Candidate | Votes | % | ± | |
---|---|---|---|---|---|
National | Gordon Simpson | 8,361 | 51.7 | +4.1 | |
Labor | Donald Sime | 4,724 | 29.2 | +9.4 | |
Liberal | John Williams | 3,078 | 19.0 | -11.4 | |
Total formal votes | 16,163 | 99.1 | |||
Informal votes | 142 | 0.9 | |||
Turnout | 16,305 | 92.0 | |||
Two-party-preferred result | |||||
National | Gordon Simpson | 11,008 | 68.1 | -6.8 | |
Labor | Donald Sime | 5,155 | 31.9 | +6.8 | |
National hold | Swing | -6.8 | |||
Party | Candidate | Votes | % | ± | |
---|---|---|---|---|---|
National | Gordon Simpson | 6,812 | 47.6 | -12.9 | |
Liberal | Henry Williams | 4,353 | 30.4 | +30.4 | |
Labor | Anthony Dames | 2,835 | 19.8 | -12.3 | |
Democratic Labor | Alexander Browne | 310 | 2.2 | -5.3 | |
Total formal votes | 14,310 | 98.9 | +0.2 | ||
Informal votes | 163 | 1.1 | -0.2 | ||
Turnout | 14,473 | 89.1 | -3.1 | ||
Two-party-preferred result | |||||
National | Gordon Simpson | 10,714 | 74.9 | +9.1 | |
Labor | Anthony Dames | 3,596 | 25.1 | -9.1 | |
Two-candidate-preferred result | |||||
National | Gordon Simpson | 7,453 | 52.1 | -13.7 | |
Liberal | Henry Williams | 6,857 | 47.9 | +47.9 | |
National hold | Swing | -13.7 | |||
Party | Candidate | Votes | % | ± | |
---|---|---|---|---|---|
Country | David Low | 7,126 | 60.4 | -1.7 | |
Labor | Anthony Dames | 3,785 | 32.1 | +1.7 | |
Democratic Labor | Alexander Browne | 878 | 7.5 | 0.0 | |
Total formal votes | 11,789 | 98.7 | |||
Informal votes | 149 | 1.3 | |||
Turnout | 11,938 | 92.2 | |||
Two-party-preferred result | |||||
Country | David Low | 7,758 | 65.8 | -1.7 | |
Labor | Anthony Dames | 4,031 | 34.2 | +1.7 | |
Country hold | Swing | -1.7 | |||
Party | Candidate | Votes | % | ± | |
---|---|---|---|---|---|
Country | David Low | 6,116 | 62.1 | +2.1 | |
Labor | Lutgerdienko Hoiting | 2,991 | 30.4 | -9.6 | |
Democratic Labor | Alexander Browne | 744 | 7.5 | +7.5 | |
Total formal votes | 9,851 | 98.4 | -0.4 | ||
Informal votes | 161 | 1.6 | +0.4 | ||
Turnout | 10,012 | 93.4 | -0.3 | ||
Two-party-preferred result | |||||
Country | David Low | 6,656 | 67.6 | +7.6 | |
Labor | Lutgerdienko Hoiting | 3,195 | 32.4 | -7.6 | |
Country hold | Swing | +7.6 | |||
Party | Candidate | Votes | % | ± | |
---|---|---|---|---|---|
Country | David Low | 5,716 | 60.0 | -1.8 | |
Labor | Kenneth Kliese | 3,813 | 40.0 | +8.8 | |
Total formal votes | 9,529 | 98.8 | +0.2 | ||
Informal votes | 111 | 1.2 | -0.2 | ||
Turnout | 9,640 | 93.7 | -0.9 | ||
Country hold | Swing | -7.8 | |||
Party | Candidate | Votes | % | ± | |
---|---|---|---|---|---|
Country | David Low | 5,746 | 61.8 | -9.2 | |
Labor | Lancelot Sanderson | 2,900 | 31.2 | +2.2 | |
Independent | Theophilus Chapman | 644 | 6.9 | +6.9 | |
Total formal votes | 9,290 | 98.6 | 0.0 | ||
Informal votes | 131 | 1.4 | 0.0 | ||
Turnout | 9,421 | 94.6 | +0.4 | ||
Two-party-preferred result | |||||
Country | David Low | 6,297 | 67.8 | -3.2 | |
Labor | Lancelot Sanderson | 2,993 | 32.2 | +3.2 | |
Country hold | Swing | -3.2 | |||
Party | Candidate | Votes | % | ± | |
---|---|---|---|---|---|
Country | David Low | 6,281 | 71.0 | ||
Labor | Lancelot Sanderson | 2,560 | 29.0 | ||
Total formal votes | 8,841 | 98.6 | |||
Informal votes | 124 | 1.4 | |||
Turnout | 8,965 | 94.2 | |||
Country hold | Swing | ||||
Party | Candidate | Votes | % | ± | |
---|---|---|---|---|---|
Country | David Low | 7,201 | 75.9 | +7.7 | |
Labor | Ralph Smith | 2,283 | 24.1 | -7.7 | |
Total formal votes | 9,484 | 98.4 | -0.8 | ||
Informal votes | 156 | 1.6 | +0.8 | ||
Turnout | 9,640 | 95.0 | +0.9 | ||
Country hold | Swing | +7.7 | |||
Party | Candidate | Votes | % | ± | |
---|---|---|---|---|---|
Country | David Low | 6,396 | 68.2 | -1.9 | |
Labor | Geoffrey Arnell | 2,978 | 31.8 | +1.9 | |
Total formal votes | 9,374 | 99.2 | -0.1 | ||
Informal votes | 72 | 0.8 | +0.1 | ||
Turnout | 9,446 | 94.1 | -0.5 | ||
Country hold | Swing | -1.9 | |||
Party | Candidate | Votes | % | ± | |
---|---|---|---|---|---|
Country | David Low | 6,359 | 70.1 | -2.5 | |
Labor | Geoffrey Arnell | 2,713 | 29.9 | +2.5 | |
Total formal votes | 9,072 | 99.3 | +0.1 | ||
Informal votes | 67 | 0.7 | -0.1 | ||
Turnout | 9,139 | 94.6 | +2.4 | ||
Country hold | Swing | -2.5 | |||
Party | Candidate | Votes | % | ± | |
---|---|---|---|---|---|
Country | David Low | 6,390 | 72.6 | ||
Labor | Geoffrey Arnell | 2,411 | 27.4 | ||
Total formal votes | 8,801 | 99.2 | |||
Informal votes | 73 | 0.8 | |||
Turnout | 8,874 | 92.2 | |||
Country hold | Swing | ||||
Party | Candidate | Votes | % | ± | |
---|---|---|---|---|---|
Country | David Low | 3,069 | 31.4 | -31.1 | |
Frank Barnes Labor | Bill Gresham | 2,693 | 27.6 | +27.6 | |
Labor | Robert Spencer | 2,217 | 22.7 | -14.8 | |
Independent Country | William Low | 1,791 | 18.3 | +18.3 | |
Total formal votes | 9,770 | 98.6 | -0.5 | ||
Informal votes | 142 | 1.4 | +0.5 | ||
Turnout | 9,912 | 92.3 | +3.3 | ||
Country hold | Swing | N/A | |||
Party | Candidate | Votes | % | ± | |
---|---|---|---|---|---|
Country | Harry Walker | 5,486 | 62.5 | -37.5 | |
Labor | Robert Spencer | 3,289 | 37.5 | +37.5 | |
Total formal votes | 8,775 | 99.1 | |||
Informal votes | 79 | 0.9 | |||
Turnout | 8,854 | 89.0 | |||
Country hold | Swing | N/A | |||
Party | Candidate | Votes | % | ± | |
---|---|---|---|---|---|
Country | Harry Walker | unopposed | |||
Country hold | Swing | ||||
Party | Candidate | Votes | % | ± | |
---|---|---|---|---|---|
Country | Harry Walker | 5,353 | 59.5 | -7.1 | |
Labor | Andrew Thompson | 2,283 | 25.4 | +25.4 | |
Social Credit | Denis Hannay | 1,364 | 15.1 | +15.1 | |
Total formal votes | 9,000 | 98.9 | +0.8 | ||
Informal votes | 100 | 1.1 | -0.8 | ||
Turnout | 9,100 | 94.4 | +0.7 | ||
Country hold | Swing | N/A | |||
Party | Candidate | Votes | % | ± | |
---|---|---|---|---|---|
CPNP | Harry Walker | 5,700 | 66.6 | ||
Women's Political Alliance | Nora Solly | 2,898 | 33.4 | ||
Total formal votes | 8,688 | 98.1 | |||
Informal votes | 165 | 1.9 | |||
Turnout | 8,853 | 93.7 | |||
CPNP hold | Swing | ||||
Party | Candidate | Votes | % | ± | |
---|---|---|---|---|---|
CPNP | Harry Walker | 4,516 | 68.4 | ||
Labor | Roy Reid | 2,087 | 31.6 | ||
Total formal votes | 6,603 | 99.3 | |||
Informal votes | 49 | 0.7 | |||
Turnout | 6,652 | 88.0 | |||
CPNP hold | Swing | ||||
Party | Candidate | Votes | % | ± | |
---|---|---|---|---|---|
CPNP | Harry Walker | unopposed | |||
CPNP hold | Swing | ||||
Party | Candidate | Votes | % | ± | |
---|---|---|---|---|---|
CPNP | Harry Walker | unopposed | |||
CPNP hold | Swing | ||||
Party | Candidate | Votes | % | ± | |
---|---|---|---|---|---|
Country | Harry Walker | unopposed | |||
Country hold | Swing | ||||
Party | Candidate | Votes | % | ± | |
---|---|---|---|---|---|
Country | Harry Walker | unopposed | |||
Country gain from National | Swing |
Party | Candidate | Votes | % | ± | |
---|---|---|---|---|---|
National | Harry Walker | 3,213 | 64.5 | +3.9 | |
Labor | Hector Spratt | 1,766 | 35.5 | -3.9 | |
Total formal votes | 4,979 | 98.9 | +0.3 | ||
Informal votes | 53 | 1.1 | -0.3 | ||
Turnout | 5,032 | 80.9 | -6.6 | ||
National hold | Swing | +3.9 | |||
Party | Candidate | Votes | % | ± | |
---|---|---|---|---|---|
Liberal | Harry Walker | 2,559 | 60.6 | -3.9 | |
Labor | Daniel O'Brien | 1,664 | 39.4 | +3.9 | |
Total formal votes | 4,223 | 98.6 | -0.5 | ||
Informal votes | 58 | 1.4 | +0.5 | ||
Turnout | 4,281 | 87.5 | +12.5 | ||
Liberal hold | Swing | -3.9 | |||
Party | Candidate | Votes | % | ± | |
---|---|---|---|---|---|
Liberal | Harry Walker | 2,206 | 64.5 | ||
Labor | William Jones | 1,216 | 35.5 | ||
Total formal votes | 3,422 | 99.1 | |||
Informal votes | 31 | 0.9 | |||
Turnout | 3,453 | 75.0 | |||
Liberal hold | Swing | ||||
Antony John Green is an Australian psephologist and commentator. He is the Australian Broadcasting Corporation's election analyst.
Elections were held in the Australian state of Queensland on 19 September 1992 to elect the 89 members of the state's Legislative Assembly.
Elections to the Australian Capital Territory Legislative Assembly were held on Saturday, 18 October 2008. The incumbent Labor Party, led by Jon Stanhope, was challenged by the Liberal Party, led by Zed Seselja. Candidates were elected to fill three multi-member electorates using a single transferable vote method, known as the Hare-Clark system. The result was another hung parliament with Labor winning seven seats, the Liberals six seats and the Greens finishing with four seats, giving the Greens the balance of power in the 17-member unicameral Assembly. On 31 October 2008, after almost two weeks of deliberations, the Greens chose to support a Labor minority government. Consequently, Labor was re-elected to a third consecutive term of government in the ACT. Stanhope was elected Chief Minister at the first sitting of the seventh Assembly on 5 November 2008. The election was conducted by the ACT Electoral Commission.
The 2010 Australian federal election was held on Saturday, 21 August 2010 to elect members of the 43rd Parliament of Australia. The incumbent centre-left Australian Labor Party led by Prime Minister Julia Gillard won a second term against the opposition centre-right Liberal Party of Australia led by Opposition Leader Tony Abbott and Coalition partner the National Party of Australia, led by Warren Truss, after Labor formed a minority government with the support of three independent MPs and one Australian Greens MP. As of 2020 this remains the last federal election victory for the Labor party.
The 2012 Queensland state election was held on 24 March 2012 to elect all 89 members of the Legislative Assembly, a unicameral parliament.
The Northern Territory general election was held on Saturday 25 August 2012, which elected all 25 members of the Legislative Assembly in the unicameral Northern Territory Parliament. The 11-year Labor Party government led by Chief Minister Paul Henderson was defeated in their attempt to win a fourth term against the opposition Country Liberal Party led by opposition leader Terry Mills with a swing of four seats, losing the normally safe Labor remote seats of Arafura, Arnhem, Daly and Stuart, whilst retaining their urban seats picked up at the 2001 election.
The 2015 Queensland state election was held on 31 January 2015 to elect all 89 members of the unicameral Legislative Assembly of Queensland.
This is a list of electoral results for the Electoral district of Fitzroy in Queensland state elections.
This is a list of electoral results for the electoral district of Charters Towers in Queensland state elections.
This is a list of electoral results for the electoral district of Cunningham in Queensland state elections.
This is a list of electoral results for the electoral district of Barambah in Queensland state elections.
This is a list of electoral results for the electoral district of Chermside in Queensland state elections.
This is a list of electoral results for the electoral district of Crows Nest in Queensland state elections.
This is a list of electoral results for the electoral district of Bowen in Queensland state elections.
This is a list of electoral results for the electoral district of Balonne in Queensland state elections.
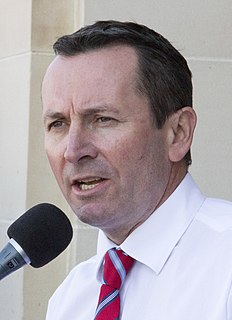
The 2017 Western Australian state election was held on Saturday 11 March 2017 to elect members to the Parliament of Western Australia, including all 59 seats in the Legislative Assembly and all 36 seats in the Legislative Council. The eight-and-a-half-year two-term incumbent Liberal–WA National government, led by Premier Colin Barnett, was defeated in a landslide by the Labor opposition, led by Opposition Leader Mark McGowan.
On 5 April 2014, an Australian Senate special election in Western Australia has held. The special election was held six months after the 2013 Australian federal election. The results of that 2013 election for the Australian Senate in Western Australia was voided on 20 February 2014 by the High Court of Australia, sitting as the Court of Disputed Returns, because 1,375 ballot papers were lost during an official recount in November 2013. The High Court ruled that because the number of lost ballots exceeded the margin for the two remaining Senate seats, the only acceptable remedy was to void the results and hold a special election.
This is a list of electoral district results for the Queensland 2006 election.
This is a list of electoral district results for the 1998 Queensland state election.
This is a list of electoral district results for the 1989 Queensland state election.