This article needs additional citations for verification .(June 2012) |
This is a list of electoral results for the electoral district of Warwick in Queensland state elections.
This article needs additional citations for verification .(June 2012) |
This is a list of electoral results for the electoral district of Warwick in Queensland state elections.
| Member | Party | Term | |
|---|---|---|---|
| St. George Richard Gore | 1860–1862 | ||
| John Gore Jones | 1862–1863 | ||
| Arnold Wienholt, Sr. | 1863–1867 | ||
| George Clark | 1867–1868 | ||
| Edmond Thornton | 1868–1870 | ||
| James Morgan | 1870–1871 | ||
| Charles Clark | 1871–1873 | ||
| James Morgan | 1873–1878 | ||
| Jacob Horwitz | Liberal | 1878–1887 | |
| Arthur Morgan | Independent | 1887–1890 | |
| Opposition | 1890–1896 | ||
| Thomas Joseph Byrnes | Ministerial | 1896–1898 | |
| Arthur Morgan | Ministerial | 1898–1903 | |
| Liberal | 1903–1906 | ||
| Thomas O'Sullivan | Liberal | 1906–1907 | |
| Kidstonites | 1907–1908 | ||
| George Powell Barnes | Farmers' Rep. | 1908–1909 | |
| Liberal | 1909–1917 | ||
| National | 1917–1922 | ||
| United | 1922–1925 | ||
| Country and Progressive National | 1925–1935 | ||
| John Healy | Labor | 1935–1947 | |
| Otto Madsen | Country | 1947–1963 | |
| David Cory | Country | 1963–1975 | |
| National Country | 1975–1977 | ||
| Des Booth | National Country | 1977–1982 | |
| National | 1982–1992 | ||
| Lawrence Springborg | National | 1992–2001 | |
| Party | Candidate | Votes | % | ±% | |
|---|---|---|---|---|---|
| National | Lawrence Springborg | 9,443 | 45.86 | −20.96 | |
| One Nation | Joan White | 6,242 | 30.32 | +30.32 | |
| Labor | Jeffrey Singleton | 4,091 | 19.87 | −8.02 | |
| Greens | Kim Olsen | 814 | 3.95 | −1.34 | |
| Total formal votes | 20,590 | 98.66 | −0.08 | ||
| Informal votes | 280 | 1.34 | +0.08 | ||
| Turnout | 20,870 | 94.30 | +0.70 | ||
| Two-candidate-preferred result | |||||
| National | Lawrence Springborg | 11,628 | 61.85 | −7.73 | |
| One Nation | Joan White | 7,172 | 38.15 | +38.15 | |
| National hold | Swing | -7.73 | |||
| Party | Candidate | Votes | % | ±% | |
|---|---|---|---|---|---|
| National | Lawrence Springborg | 13,393 | 66.82 | +10.77 | |
| Labor | Michael Bathersby | 5,590 | 27.89 | −9.18 | |
| Greens | Sarah Moles | 1,061 | 5.29 | +5.29 | |
| Total formal votes | 20,044 | 98.74 | +0.61 | ||
| Informal votes | 256 | 1.26 | −0.61 | ||
| Turnout | 20,300 | 93.60 | +0.07 | ||
| Two-party-preferred result | |||||
| National | Lawrence Springborg | 13,792 | 69.58 | +8.15 | |
| Labor | Michael Bathersby | 6,031 | 30.42 | −8.15 | |
| National hold | Swing | +8.15 | |||
| Party | Candidate | Votes | % | ±% | |
|---|---|---|---|---|---|
| National | Lawrence Springborg | 11,287 | 56.1 | +15.5 | |
| Labor | Michael Bathersby | 7,464 | 37.1 | +6.4 | |
| Liberal | Ruth Buchanan | 1,386 | 6.9 | −8.0 | |
| Total formal votes | 20,137 | 98.1 | |||
| Informal votes | 384 | 1.9 | |||
| Turnout | 20,521 | 93.5 | |||
| Two-party-preferred result | |||||
| National | Lawrence Springborg | 12,236 | 61.4 | +0.4 | |
| Labor | Michael Bathersby | 7,683 | 38.6 | −0.4 | |
| National hold | Swing | +0.4 | |||
| Party | Candidate | Votes | % | ±% | |
|---|---|---|---|---|---|
| National | Des Booth | 4,945 | 41.0 | −31.1 | |
| Labor | Bev Brennan | 3,399 | 28.2 | +0.3 | |
| Liberal | Peter Beatty | 2,032 | 16.9 | +16.9 | |
| Independent | Bev Shelley | 1,682 | 13.9 | +13.9 | |
| Total formal votes | 12,058 | 97.9 | −0.3 | ||
| Informal votes | 254 | 2.1 | +0.3 | ||
| Turnout | 12,312 | 92.6 | −0.9 | ||
| Two-party-preferred result | |||||
| National | Des Booth | 7,723 | 64.0 | −8.1 | |
| Labor | Bev Brennan | 4,335 | 36.0 | +8.1 | |
| National hold | Swing | -8.1 | |||
| Party | Candidate | Votes | % | ±% | |
|---|---|---|---|---|---|
| National | Des Booth | 8,158 | 72.1 | +1.5 | |
| Labor | Bev Brennan | 3,151 | 27.9 | −1.5 | |
| Total formal votes | 11,309 | 98.2 | −0.1 | ||
| Informal votes | 209 | 1.8 | +0.1 | ||
| Turnout | 11,518 | 93.5 | −0.3 | ||
| National hold | Swing | +1.5 | |||
| Party | Candidate | Votes | % | ±% | |
|---|---|---|---|---|---|
| National | Des Booth | 6,921 | 67.9 | +3.5 | |
| Labor | Mary Hill | 3,278 | 32.1 | +3.1 | |
| Total formal votes | 10,199 | 98.3 | −0.7 | ||
| Informal votes | 172 | 1.7 | +0.7 | ||
| Turnout | 10,371 | 93.8 | +2.1 | ||
| National hold | Swing | +0.2 | |||
| Party | Candidate | Votes | % | ±% | |
|---|---|---|---|---|---|
| National | Des Booth | 6,199 | 64.4 | +11.5 | |
| Labor | Stephen Fazackerley | 2,790 | 29.0 | +0.5 | |
| Democrats | Maria Heyboer | 632 | 6.6 | +6.6 | |
| Total formal votes | 9,621 | 99.0 | +0.1 | ||
| Informal votes | 93 | 1.0 | −0.1 | ||
| Turnout | 9,714 | 91.7 | −1.5 | ||
| Two-party-preferred result | |||||
| National | Des Booth | 6,509 | 67.7 | −1.2 | |
| Labor | Stephen Fazackerley | 3,112 | 32.3 | +1.2 | |
| National hold | Swing | -1.2 | |||
| Party | Candidate | Votes | % | ±% | |
|---|---|---|---|---|---|
| National | Des Booth | 5,013 | 52.9 | −21.9 | |
| Labor | Graham Dorman | 2,699 | 28.5 | −3.3 | |
| Liberal | Raymond McNamara | 1,764 | 18.6 | +18.6 | |
| Total formal votes | 9,476 | 98.9 | |||
| Informal votes | 102 | 1.1 | |||
| Turnout | 9,578 | 93.2 | |||
| Two-party-preferred result | |||||
| National | Des Booth | 6,530 | 68.9 | −5.9 | |
| Labor | Graham Dorman | 2,946 | 31.1 | +5.9 | |
| National hold | Swing | -5.9 | |||
| Party | Candidate | Votes | % | ±% | |
|---|---|---|---|---|---|
| National | David Cory | 7,052 | 74.8 | +25.5 | |
| Labor | Raymond Lyons | 2,374 | 25.2 | −10.2 | |
| Total formal votes | 9,426 | 98.8 | −0.1 | ||
| Informal votes | 112 | 1.2 | +0.1 | ||
| Turnout | 9,538 | 91.9 | −3.0 | ||
| National hold | Swing | +13.3 | |||
| Party | Candidate | Votes | % | ±% | |
|---|---|---|---|---|---|
| Country | David Cory | 4,258 | 49.3 | −4.5 | |
| Labor | Raymond Lyons | 3,053 | 35.4 | −2.6 | |
| Queensland Labor | Daniel Skehan | 679 | 7.9 | −0.3 | |
| Independent | Norman Stuart | 641 | 7.4 | +7.4 | |
| Total formal votes | 8,631 | 98.9 | |||
| Informal votes | 98 | 1.1 | |||
| Turnout | 8,729 | 94.9 | |||
| Two-party-preferred result | |||||
| Country | David Cory | 5,305 | 61.5 | +0.2 | |
| Labor | Raymond Lyons | 3,326 | 38.5 | −0.2 | |
| Country hold | Swing | +0.2 | |||
| Party | Candidate | Votes | % | ±% | |
|---|---|---|---|---|---|
| Country | David Cory | 4,276 | 53.8 | −5.1 | |
| Labor | Raymond Lyons | 3,014 | 38.0 | +5.0 | |
| Queensland Labor | Daniel Skehan | 650 | 8.2 | +0.1 | |
| Total formal votes | 7,940 | 99.1 | +0.2 | ||
| Informal votes | 70 | 0.9 | −0.2 | ||
| Turnout | 8,010 | 95.4 | −0.5 | ||
| Two-party-preferred result | |||||
| Country | David Cory | 4,805 | 60.5 | −5.0 | |
| Labor | Raymond Lyons | 3,135 | 39.5 | +5.0 | |
| Country hold | Swing | -5.0 | |||
| Party | Candidate | Votes | % | ±% | |
|---|---|---|---|---|---|
| Country | David Cory | 4,816 | 58.9 | −2.5 | |
| Labor | Eric Barrett | 2,701 | 33.0 | +9.0 | |
| Queensland Labor | Daniel Skehan | 659 | 8.1 | −6.4 | |
| Total formal votes | 8,176 | 98.9 | +0.1 | ||
| Informal votes | 90 | 1.1 | −0.1 | ||
| Turnout | 8,266 | 95.9 | +0.1 | ||
| Two-party-preferred result | |||||
| Country | David Cory | 5,352 | 65.5 | −7.8 | |
| Labor | Eric Barrett | 2,824 | 34.5 | +7.8 | |
| Country hold | Swing | -7.8 | |||
| Party | Candidate | Votes | % | ±% | |
|---|---|---|---|---|---|
| Country | Otto Madsen | 5,152 | 61.4 | −2.5 | |
| Labor | Reggie Wenham | 2,016 | 24.0 | +2.6 | |
| Queensland Labor | Daniel Skehan | 1,217 | 14.5 | −0.2 | |
| Total formal votes | 8,385 | 98.8 | +0.1 | ||
| Informal votes | 105 | 1.2 | −0.1 | ||
| Turnout | 8,490 | 95.8 | +1.2 | ||
| Two-party-preferred result | |||||
| Country | Otto Madsen | 6,143 | 73.3 | ||
| Labor | Reggie Wenham | 2,242 | 26.7 | ||
| Country hold | Swing | N/A | |||
| Party | Candidate | Votes | % | ±% | |
|---|---|---|---|---|---|
| Country | Otto Madsen | 5,437 | 63.9 | ||
| Labor | Reggie Wenham | 1,818 | 21.4 | ||
| Queensland Labor | George Campbell | 1,254 | 14.7 | ||
| Total formal votes | 8,509 | 98.7 | |||
| Informal votes | 108 | 1.3 | |||
| Turnout | 8,617 | 94.6 | |||
| Country hold | Swing | ||||
| Party | Candidate | Votes | % | ±% | |
|---|---|---|---|---|---|
| Country | Otto Madsen | 5,695 | 65.3 | +1.7 | |
| Queensland Labor | George Wilkinson | 3,026 | 34.7 | +34.7 | |
| Total formal votes | 8,721 | 98.4 | −0.7 | ||
| Informal votes | 142 | 1.6 | +0.7 | ||
| Turnout | 8,863 | 95.8 | −0.4 | ||
| Country hold | Swing | +1.7 | |||
| Party | Candidate | Votes | % | ±% | |
|---|---|---|---|---|---|
| Country | Otto Madsen | 5,483 | 63.6 | −1.2 | |
| Labor | Frank Drew | 3,137 | 36.4 | +1.2 | |
| Total formal votes | 8,620 | 99.1 | −0.1 | ||
| Informal votes | 81 | 0.9 | +0.1 | ||
| Turnout | 8,701 | 96.2 | +0.5 | ||
| Country hold | Swing | -1.2 | |||
| Party | Candidate | Votes | % | ±% | |
|---|---|---|---|---|---|
| Country | Otto Madsen | 5,651 | 64.8 | −3.6 | |
| Labor | John O'Brien | 3,069 | 35.2 | +3.6 | |
| Total formal votes | 8,720 | 99.2 | 0.0 | ||
| Informal votes | 67 | 0.8 | 0.0 | ||
| Turnout | 8,787 | 95.7 | +2.3 | ||
| Country hold | Swing | -3.6 | |||
| Party | Candidate | Votes | % | ±% | |
|---|---|---|---|---|---|
| Country | Otto Madsen | 5,965 | 68.4 | ||
| Labor | Terry Keane | 2,758 | 31.6 | ||
| Total formal votes | 8,723 | 99.2 | |||
| Informal votes | 67 | 0.8 | |||
| Turnout | 8,790 | 93.4 | |||
| Country hold | Swing | ||||
| Party | Candidate | Votes | % | ±% | |
|---|---|---|---|---|---|
| Country | Otto Madsen | 4,657 | 51.7 | +6.1 | |
| Labor | John Healy | 4,347 | 48.3 | −6.1 | |
| Total formal votes | 9,004 | 99.2 | +2.5 | ||
| Informal votes | 72 | 0.8 | −2.5 | ||
| Turnout | 9,076 | 89.7 | −0.5 | ||
| Country gain from Labor | Swing | +6.1 | |||
| Party | Candidate | Votes | % | ±% | |
|---|---|---|---|---|---|
| Labor | John Healy | 4,656 | 54.4 | −0.6 | |
| People's Party | Richard Matthews | 3,901 | 45.6 | +0.6 | |
| Total formal votes | 8,557 | 96.7 | −2.4 | ||
| Informal votes | 296 | 3.3 | +2.4 | ||
| Turnout | 8,853 | 90.2 | −1.1 | ||
| Labor hold | Swing | -0.6 | |||
| Party | Candidate | Votes | % | ±% | |
|---|---|---|---|---|---|
| Labor | John Healy | 4,766 | 55.0 | +2.2 | |
| Country | Richard Matthews | 3,899 | 45.0 | −2.2 | |
| Total formal votes | 8,665 | 99.1 | −0.1 | ||
| Informal votes | 81 | 0.9 | +0.1 | ||
| Turnout | 8,746 | 91.3 | −1.7 | ||
| Labor hold | Swing | +2.2 | |||
| Party | Candidate | Votes | % | ±% | |
|---|---|---|---|---|---|
| Labor | John Healy | 4,693 | 52.8 | +7.0 | |
| Country | Edward Costello | 4,196 | 47.2 | +5.5 | |
| Total formal votes | 8,889 | 99.2 | −0.2 | ||
| Informal votes | 68 | 0.8 | +0.2 | ||
| Turnout | 8,957 | 93.0 | −1.3 | ||
| Labor hold | Swing | +2.6 | |||
| Party | Candidate | Votes | % | ±% | |
|---|---|---|---|---|---|
| Labor | John Healy | 4,096 | 45.8 | ||
| CPNP | Daniel Connolly | 3,736 | 41.7 | ||
| Independent | Herbert Dight | 1,119 | 12.5 | ||
| Total formal votes | 8,951 | 99.4 | |||
| Informal votes | 57 | 0.6 | |||
| Turnout | 9,008 | 94.3 | |||
| Two-party-preferred result | |||||
| Labor | John Healy | 4,247 | 50.2 | ||
| CPNP | Daniel Connolly | 4,215 | 49.8 | ||
| Labor gain from CPNP | Swing | ||||
| Party | Candidate | Votes | % | ±% | |
|---|---|---|---|---|---|
| CPNP | George Barnes | 3,865 | 51.7 | ||
| Labor | John Healy | 3,399 | 45.5 | ||
| Queensland Party | Alice Chambers | 209 | 2.8 | ||
| Total formal votes | 7,473 | 99.4 | |||
| Informal votes | 43 | 0.6 | |||
| Turnout | 7,516 | 96.1 | |||
| CPNP hold | Swing | ||||
| Party | Candidate | Votes | % | ±% | |
|---|---|---|---|---|---|
| CPNP | George Barnes | 3,598 | 56.0 | +1.4 | |
| Labor | Patrick McMahon | 2,827 | 44.0 | −1.4 | |
| Total formal votes | 6,425 | 99.1 | 0.0 | ||
| Informal votes | 59 | 0.9 | 0.0 | ||
| Turnout | 6,484 | 92.2 | +2.6 | ||
| CPNP hold | Swing | +1.4 | |||
| Party | Candidate | Votes | % | ±% | |
|---|---|---|---|---|---|
| CPNP | George Barnes | 3,261 | 54.6 | +0.8 | |
| Labor | George James | 2,708 | 45.4 | −0.8 | |
| Total formal votes | 5,969 | 99.1 | −0.2 | ||
| Informal votes | 52 | 0.9 | +0.2 | ||
| Turnout | 6,021 | 89.6 | +3.3 | ||
| CPNP hold | Swing | +0.8 | |||
| Party | Candidate | Votes | % | ±% | |
|---|---|---|---|---|---|
| United | George Barnes | 3,128 | 53.8 | −1.2 | |
| Labor | George Campbell | 2,685 | 46.2 | +1.2 | |
| Total formal votes | 5,813 | 99.3 | +0.1 | ||
| Informal votes | 43 | 0.7 | −0.1 | ||
| Turnout | 5,856 | 86.3 | +0.7 | ||
| United hold | Swing | -1.2 | |||
| Party | Candidate | Votes | % | ±% | |
|---|---|---|---|---|---|
| National | George Barnes | 2,448 | 55.0 | +1.0 | |
| Labor | Donald Beatson | 2,006 | 45.0 | −1.0 | |
| Total formal votes | 4,454 | 99.2 | −0.1 | ||
| Informal votes | 35 | 0.8 | +0.1 | ||
| Turnout | 4,489 | 85.6 | +1.8 | ||
| National hold | Swing | +1.0 | |||
| Party | Candidate | Votes | % | ±% | |
|---|---|---|---|---|---|
| National | George Barnes | 2,319 | 54.0 | +4.7 | |
| Labor | David Swiss-Davies | 1,974 | 46.0 | +19.8 | |
| Total formal votes | 4,293 | 99.3 | +0.5 | ||
| Informal votes | 32 | 0.7 | −0.5 | ||
| Turnout | 4,325 | 83.8 | −8.5 | ||
| National hold | Swing | -8.0 | |||
| Party | Candidate | Votes | % | ±% | |
|---|---|---|---|---|---|
| Liberal | George Barnes | 1,961 | 49.3 | −10.1 | |
| Labor | Paul Bauers | 1,043 | 26.2 | −14.4 | |
| Independent | Daniel Connolly | 973 | 24.5 | +24.5 | |
| Total formal votes | 3,977 | 98.8 | 0.0 | ||
| Informal votes | 49 | 1.2 | 0.0 | ||
| Turnout | 4,026 | 92.3 | +22.0 | ||
| Two-party-preferred result | |||||
| Liberal | George Barnes | 1,989 | 62.0 | +2.6 | |
| Labor | Paul Bauers | 1,220 | 38.0 | −2.6 | |
| Liberal hold | Swing | +2.6 | |||
| Party | Candidate | Votes | % | ±% | |
|---|---|---|---|---|---|
| Liberal | George Barnes | 1,915 | 59.4 | ||
| Labor | Angus Sinclair | 1,307 | 40.6 | ||
| Total formal votes | 3,222 | 98.8 | |||
| Informal votes | 38 | 1.2 | |||
| Turnout | 3,260 | 70.3 | |||
| Liberal hold | Swing | ||||

Warwick and Leamington is a constituency represented in the House of Commons of the UK Parliament since the 2017 general election by Matt Western of the Labour Party.
The Division of Maranoa is an Australian electoral division in Queensland.

Rugby and Kenilworth was a county constituency in Warwickshire, England. It returned one Member of Parliament to the House of Commons of the Parliament of the United Kingdom. It existed from 1983 to 2010.
Lotbinière was a federal electoral district in Quebec, Canada, that was represented in the House of Commons of Canada from 1867 to 2004.

Cities of London and Westminster is a constituency returning a single Member of Parliament (MP) to the House of Commons in the United Kingdom Parliament. As with all constituencies, the election is decided using the first past the post system of election. From its creation at the 1950 general election to the 2024 general election, the constituency had always elected the candidate nominated by the Conservative Party.

Stratford-on-Avon is a constituency represented in the House of Commons of the UK Parliament since 2024 by Manuela Perteghella. The constituency is in Warwickshire; as its name suggests, it is centred on the town of Stratford-upon-Avon, birthplace of William Shakespeare, but also takes in the surrounding areas, including the towns of Alcester and Henley-in-Arden.

Brent South was a constituency for the House of Commons of the UK Parliament; the areas of the constituency chiefly fell into the new Brent Central for the 2010 general election which was the date of its abolition. It elected one member (MP) by the first past the post system of election.
Warwick District Council elections are held every four years. Warwick District Council is the local authority for the non-metropolitan district of Warwick in Warwickshire, England. Since the last boundary changes in 2019, 44 councillors have been elected from 17 wards.

Kenilworth and Southam is a constituency in Warwickshire, England represented in the House of Commons of the UK Parliament since 2010 by Jeremy Wright, a Conservative who served as Culture Secretary until 24 July 2019, having previously served as Attorney General for England and Wales from 2014 to 2018.
The Shire of Warwick was a local government area in the Darling Downs region of Queensland, Australia. The administrative centre and major town of the shire was the town of Warwick.
The Southern Downs Region is a local government area (LGA) in the Darling Downs region of Queensland, Australia. The region runs along the state's southern boundary with New South Wales and was created in 2008 from a merger of the Shire of Warwick and the Shire of Stanthorpe.
The Shire of Allora was a local government area north of the regional centre of Warwick in the Darling Downs region of Queensland. The shire, administered from Allora, covered an area of 702.0 square kilometres (271.0 sq mi), and existed as a local government entity from 1869 until 1994, when it was dissolved and amalgamated with City of Warwick, Shire of Rosenthal and Shire of Glengallan to form the Shire of Warwick.
The Shire of Glengallan was a local government area south and east of the regional centre of Warwick in the Darling Downs region of Queensland. The shire, administered from Warwick, covered an area of 1,699.6 square kilometres (656.2 sq mi), and existed as a local government entity from 1879 until 1994, when it was dissolved and amalgamated with City of Warwick, Shire of Rosenthal and Shire of Allora to form the Shire of Warwick.

The City of Warwick was a local government area administering the regional centre of Warwick in the Darling Downs region of Queensland. The City covered an area of 25.1 square kilometres (9.7 sq mi), and existed as a local government entity from 1861 until 1994, when it was dissolved and amalgamated with Shire of Allora, Shire of Rosenthal and Shire of Glengallan to form the Shire of Warwick.

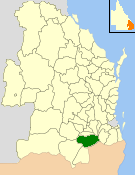
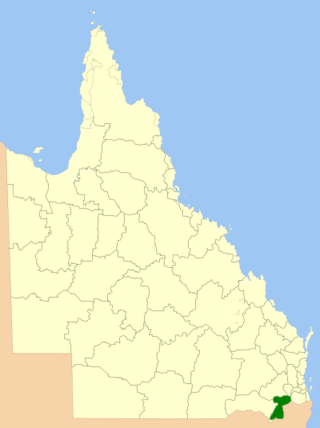
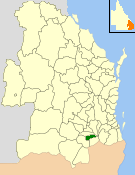
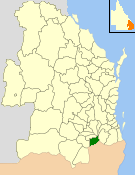
Southern Downs is an electoral district of the Legislative Assembly in the Australian state of Queensland. It was created in 2001 as a replacement for Warwick.
Drummond–Bois-Francs is a provincial electoral district in the Centre-du-Québec region of Quebec, Canada, that elects members to the National Assembly of Quebec. It notably includes parts of the city of Drummondville as well as Saint-Cyrille-de-Wendover, Warwick, Kingsey Falls and Saint-Lucien

The 2016 United States presidential election in Rhode Island took place on November 8, 2016, as part of the 2016 United States presidential election in which all 50 states plus the District of Columbia participated. Rhode Island voters chose four electors to represent them in the Electoral College via a popular vote.

The 2020 United States presidential election in Rhode Island was held on Tuesday, November 3, 2020, as part of the 2020 United States presidential election in which all 50 states plus the District of Columbia participated. Rhode Island voters chose electors to represent them in the Electoral College via a popular vote, pitting the Republican Party's nominee, incumbent President Donald Trump, and running mate Vice President Mike Pence against Democratic Party nominee, former Vice President Joe Biden, and his running mate California Senator Kamala Harris. Rhode Island has four electoral votes in the Electoral College.

The 2019 Warwick District Council election took place on 2 May 2019 to elect members of Warwick District Council in England. This was on the same day as other local elections. The whole council was up for election on new boundaries. The Conservative Party lost control of the council.