This is a list of electoral results for the electoral district of Albert in Queensland state elections.
First incarnation (1888–1950) | |||
---|---|---|---|
Member | Party | Term | |
Thomas Plunkett Sr. | Conservative | 1888–1890 | |
Ministerialist | 1890–1896 | ||
Robert Collins | Independent | 1896–1899 | |
Thomas Plunkett Sr. | Opposition | 1899–1903 | |
Liberal | 1903–1907 | ||
Kidstonites | 1907–1908 | ||
John Appel | Conservative | 1908–1909 | |
Liberal | 1909–1915 | ||
Farmers' Union | 1915–1917 | ||
National | 1917–1919 | ||
Country | 1919–1922 | ||
United | 1922–1925 | ||
CPNP | 1925–1929 | ||
Thomas Plunkett Jr. | CPNP | 1929–1936 | |
Country | 1936–1950 | ||
Second incarnation (1960–2017) | |||
Member | Party | Term | |
Cec Carey | Country | 1960–1969 | |
Bill Heatley | Liberal | 1970–1971 | |
Bill D'Arcy | Labor | 1972–1974 | |
Ivan Gibbs | National | 1974–1989 | |
John Szczerbanik | Labor | 1989–1995 | |
Bill Baumann | National | 1995–2001 | |
Margaret Keech | Labor | 2001–2012 | |
Mark Boothman | Liberal National | 2012–2017 |
Party | Candidate | Votes | % | ± | |
---|---|---|---|---|---|
Liberal National | Mark Boothman | 13,597 | 43.13 | −6.46 | |
Labor | Melissa McMahon | 11,145 | 35.35 | +6.99 | |
Palmer United | Blair Brewster | 3,428 | 10.87 | +10.87 | |
Greens | Jane Cajdler | 1,923 | 6.10 | +0.70 | |
Family First | Amanda Best | 1,434 | 4.55 | −1.24 | |
Total formal votes | 31,527 | 97.21 | +0.04 | ||
Informal votes | 906 | 2.79 | −0.04 | ||
Turnout | 32,433 | 88.33 | −3.09 | ||
Two-party-preferred result | |||||
Liberal National | Mark Boothman | 14,872 | 51.67 | −10.22 | |
Labor | Melissa McMahon | 13,911 | 48.33 | +10.22 | |
Liberal National hold | Swing | −10.22 | |||
Party | Candidate | Votes | % | ± | |
---|---|---|---|---|---|
Liberal National | Mark Boothman | 13,888 | 49.59 | +10.43 | |
Labor | Margaret Keech | 7,943 | 28.36 | -21.69 | |
Katter's Australian | Adam Hollis | 3,045 | 10.87 | +10.87 | |
Family First | Amanda Best | 1,620 | 5.78 | +5.78 | |
Greens | Petrina Maizey | 1,511 | 5.40 | -1.68 | |
Total formal votes | 28,007 | 97.17 | -0.33 | ||
Informal votes | 817 | 2.83 | +0.33 | ||
Turnout | 28,824 | 91.43 | +1.13 | ||
Two-party-preferred result | |||||
Liberal National | Mark Boothman | 15,198 | 61.89 | +18.36 | |
Labor | Margaret Keech | 9,358 | 38.11 | -18.36 | |
Liberal National gain from Labor | Swing | +18.36 |
Party | Candidate | Votes | % | ± | |
---|---|---|---|---|---|
Labor | Margaret Keech | 12,649 | 49.98 | -7.2 | |
Liberal National | Andrea Johanson | 9,841 | 38.89 | +7.4 | |
Greens | Marlee Bruinsma | 1,792 | 7.08 | -0.2 | |
Independent | Geoff Flannery | 1,024 | 4.05 | +4.0 | |
Total formal votes | 25,306 | 97.50 | +0.4 | ||
Informal votes | 648 | 2.50 | –0.4 | ||
Turnout | 25,954 | 90.30 | |||
Two-party-preferred result | |||||
Labor | Margaret Keech | 13,409 | 56.47 | -7.3 | |
Liberal National | Andrea Johanson | 10,335 | 43.53 | +7.3 | |
Labor hold | Swing | -7.3 | |||
Party | Candidate | Votes | % | ± | |
---|---|---|---|---|---|
Labor | Margaret Keech | 17,429 | 60.0 | +0.0 | |
Liberal | Karen Woodrow | 8,161 | 28.1 | +0.5 | |
Greens | Marella Pettinato | 1,799 | 6.2 | +0.9 | |
Family First | Jonathon Eaton | 1,682 | 5.8 | +5.8 | |
Total formal votes | 29,071 | 97.4 | -0.0 | ||
Informal votes | 789 | 2.6 | +0.0 | ||
Turnout | 29,860 | 89.6 | -1.1 | ||
Two-party-preferred result | |||||
Labor | Margaret Keech | 18,312 | 67.0 | -0.3 | |
Liberal | Karen Woodrow | 9,017 | 33.0 | +0.3 | |
Labor hold | Swing | -0.3 | |||
Party | Candidate | Votes | % | ± | |
---|---|---|---|---|---|
Labor | Margaret Keech | 15,438 | 60.0 | +9.4 | |
Liberal | Corey Kolar | 7,101 | 27.6 | +14.0 | |
One Nation | Chris Coyle | 1,826 | 7.1 | -16.7 | |
Greens | Bill Livermore | 1,364 | 5.3 | +5.3 | |
Total formal votes | 25,729 | 97.4 | -0.1 | ||
Informal votes | 673 | 2.6 | +0.1 | ||
Turnout | 26,402 | 90.7 | -1.5 | ||
Two-party-preferred result | |||||
Labor | Margaret Keech | 16,173 | 67.3 | +4.7 | |
Liberal | Corey Kolar | 7,869 | 32.7 | +32.7 | |
Labor hold | Swing | +4.7 | |||
Party | Candidate | Votes | % | ± | |
---|---|---|---|---|---|
Labor | Margaret Keech | 11,551 | 50.6 | +13.4 | |
One Nation | Rod Evans | 5,438 | 23.8 | -5.1 | |
Liberal | Andrea Johanson | 3,092 | 13.6 | +10.2 | |
National | Tony McMullan | 2,725 | 11.9 | -13.5 | |
Total formal votes | 22,806 | 97.5 | |||
Informal votes | 578 | 2.5 | |||
Turnout | 23,384 | 92.2 | |||
Two-candidate-preferred result | |||||
Labor | Margaret Keech | 13,207 | 62.6 | +12.9 | |
One Nation | Rod Evans | 7,875 | 37.4 | +37.4 | |
Labor gain from National | Swing | +12.9 |
Party | Candidate | Votes | % | ± | |
---|---|---|---|---|---|
National | Bill Baumann | 9,920 | 33.8 | -14.2 | |
Labor | Peter Shooter | 9,772 | 33.3 | -6.3 | |
One Nation | Rod Evans | 7,909 | 26.9 | +26.9 | |
Greens | Sally Spain | 1,472 | 5.0 | -1.2 | |
Reform | Lyn Green | 305 | 1.0 | +1.0 | |
Total formal votes | 29,378 | 98.3 | +0.2 | ||
Informal votes | 519 | 1.7 | -0.2 | ||
Turnout | 29,897 | 91.7 | |||
Two-party-preferred result | |||||
National | Bill Baumann | 14,500 | 54.8 | +0.9 | |
Labor | Peter Shooter | 11,943 | 45.2 | -0.9 | |
National hold | Swing | +0.9 | |||
Party | Candidate | Votes | % | ± | |
---|---|---|---|---|---|
National | Bill Baumann | 11,505 | 47.9 | +19.4 | |
Labor | John Szczerbanik | 9,499 | 39.6 | -8.7 | |
Greens | Bill Heck | 1,491 | 6.2 | +6.2 | |
Democrats | Sharon Lucht | 998 | 4.2 | +4.2 | |
Independent | John O'Connor | 515 | 2.1 | +2.1 | |
Total formal votes | 24,008 | 98.1 | +0.6 | ||
Informal votes | 468 | 1.9 | -0.6 | ||
Turnout | 24,476 | 90.5 | |||
Two-party-preferred result | |||||
National | Bill Baumann | 12,392 | 53.9 | +5.5 | |
Labor | John Szczerbanik | 10,602 | 46.1 | -5.5 | |
National gain from Labor | Swing | +5.5 |
Party | Candidate | Votes | % | ± | |
---|---|---|---|---|---|
Labor | John Szczerbanik | 9,388 | 48.3 | +3.4 | |
National | Paul Flann | 5,541 | 28.5 | -0.2 | |
Liberal | David Logan | 4,512 | 23.2 | -1.3 | |
Total formal votes | 19,441 | 97.5 | |||
Informal votes | 497 | 2.5 | |||
Turnout | 19,938 | 90.9 | |||
Two-party-preferred result | |||||
Labor | John Szczerbanik | 9,753 | 51.6 | -8.8 | |
National | Paul Flann | 9,132 | 48.4 | +8.8 | |
Labor hold | Swing | -8.8 | |||
Party | Candidate | Votes | % | ± | |
---|---|---|---|---|---|
Labor | John Szczerbanik | 10,511 | 42.5 | +10.5 | |
National | Ivan Gibbs | 7,106 | 28.8 | -20.3 | |
Liberal | Kay Elson | 6,690 | 27.1 | +8.2 | |
Advance Australia | John Ivory | 404 | 1.6 | +1.6 | |
Total formal votes | 24,711 | 97.1 | -0.9 | ||
Informal votes | 730 | 2.9 | +0.9 | ||
Turnout | 25,441 | 91.0 | +0.6 | ||
Two-party-preferred result | |||||
Labor | John Szczerbanik | 14,749 | 59.7 | +22.8 | |
National | Ivan Gibbs | 9,962 | 40.3 | -22.8 | |
Labor gain from National | Swing | +22.8 |
Party | Candidate | Votes | % | ± | |
---|---|---|---|---|---|
National | Ivan Gibbs | 8,351 | 49.1 | -7.4 | |
Labor | Tom Harrison | 5,446 | 32.0 | -11.5 | |
Liberal | Vince Camilleri | 3,222 | 18.9 | +18.9 | |
Total formal votes | 17,019 | 98.0 | |||
Informal votes | 345 | 2.0 | |||
Turnout | 17,364 | 90.4 | |||
Two-party-preferred result | |||||
National | Ivan Gibbs | 10,744 | 63.1 | +4.3 | |
Labor | Tom Harrison | 6,275 | 36.9 | -4.3 | |
National hold | Swing | +4.3 | |||
Party | Candidate | Votes | % | ± | |
---|---|---|---|---|---|
National | Ivan Gibbs | 14,595 | 56.5 | +11.7 | |
Labor | Walter Ehrich | 11,239 | 43.5 | +9.8 | |
Total formal votes | 25,834 | 97.6 | -0.5 | ||
Informal votes | 639 | 2.4 | +0.5 | ||
Turnout | 26,473 | 89.1 | +3.2 | ||
National hold | Swing | -4.4 | |||
Party | Candidate | Votes | % | ± | |
---|---|---|---|---|---|
National | Ivan Gibbs | 8,730 | 44.8 | -8.5 | |
Labor | Harry Zaphir | 6,565 | 33.7 | -9.6 | |
Liberal | John Juett | 3,342 | 17.1 | +17.1 | |
Democrats | Peter Woolley | 501 | 2.6 | +2.6 | |
Independent | Reginald Campbell | 351 | 1.8 | +1.8 | |
Total formal votes | 19,489 | 98.1 | +0.2 | ||
Informal votes | 383 | 1.9 | -0.2 | ||
Turnout | 19,872 | 85.9 | -3.5 | ||
Two-party-preferred result | |||||
National | Ivan Gibbs | 11,877 | 60.9 | +5.9 | |
Labor | Harry Zaphir | 7,612 | 39.1 | -5.9 | |
National hold | Swing | +5.9 | |||
Party | Candidate | Votes | % | ± | |
---|---|---|---|---|---|
National | Ivan Gibbs | 8,010 | 53.3 | +16.6 | |
Labor | Denis O'Connell | 4,582 | 30.5 | -6.0 | |
Labor | Cecil Clark | 1,922 | 12.8 | +12.8 | |
Independent | Alex McMillan | 295 | 2.0 | +2.0 | |
Independent | Ace Drabsch | 229 | 1.5 | +1.5 | |
Total formal votes | 15,038 | 97.9 | |||
Informal votes | 320 | 2.1 | |||
Turnout | 15,358 | 89.5 | |||
Two-party-preferred result | |||||
National | Ivan Gibbs | 8,271 | 55.0 | -6.2 | |
Labor | Denis O'Connell | 6,766 | 45.0 | +6.2 | |
National hold | Swing | -6.2 | |||
Party | Candidate | Votes | % | ± | |
---|---|---|---|---|---|
National | Ivan Gibbs | 6,622 | 36.6 | +7.8 | |
Labor | Bill D'Arcy | 6,599 | 36.5 | -14.0 | |
Liberal | K. Brough | 4,543 | 25.1 | +8.9 | |
Independent | J.W. Black | 174 | 1.0 | -0.1 | |
Democratic Labor | H.W. Trigger | 130 | 0.7 | -2.0 | |
Total formal votes | 18,068 | 97.2 | -0.5 | ||
Informal votes | 526 | 2.8 | +0.5 | ||
Turnout | 18,594 | 87.1 | -2.6 | ||
Two-party-preferred result | |||||
National | Ivan Gibbs | 10,867 | 60.1 | +14.2 | |
Labor | Bill D'Arcy | 7,201 | 39.9 | -14.2 | |
National gain from Labor | Swing | +14.2 |
Party | Candidate | Votes | % | ± | |
---|---|---|---|---|---|
Labor | Bill D'Arcy | 6,781 | 50.5 | +30.9 | |
Country | Ivan Gibbs | 3,876 | 28.8 | -21.8 | |
Liberal | R.E. Allen | 2,183 | 16.2 | +3.3 | |
Democratic Labor | T.L. McKenzie | 357 | 2.7 | +0.1 | |
Independent | J.W. Black | 141 | 1.1 | +1.1 | |
Independent | W.L. Wollstein | 101 | 0.8 | +0.8 | |
Total formal votes | 13,439 | 97.7 | |||
Informal votes | 319 | 2.3 | |||
Turnout | 13,758 | 89.7 | |||
Two-party-preferred result | |||||
Labor | Bill D'Arcy | 7,268 | 54.1 | +23.3 | |
Country | Ivan Gibbs | 6,171 | 45.9 | -23.3 | |
Labor gain from Country | Swing | +23.3 |
Party | Candidate | Votes | % | ± | |
---|---|---|---|---|---|
Labor | Bill D'Arcy | 6,143 | 43.0 | +23.4 | |
Liberal | Bill Heatley | 3,899 | 27.3 | +14.4 | |
Country | D.F.C. Beck | 3,820 | 26.7 | -23.8 | |
Independent | E.A. Nunn | 416 | 2.9 | +2.9 | |
Total formal votes | 14,278 | 99.0 | +1.4 | ||
Informal votes | 148 | 1.0 | -1.4 | ||
Turnout | 14,426 | 88.7 | -0.6 | ||
Two-party-preferred result | |||||
Liberal | Bill Heatley | 7,206 | 50.5 | +50.5 | |
Labor | Bill D'Arcy | 7,072 | 49.5 | +24.7 | |
Liberal gain from Country | Swing | +50.5 |
Party | Candidate | Votes | % | ± | |
---|---|---|---|---|---|
Country | Cec Carey | 7,081 | 50.6 | +8.9 | |
Labor | William Woollstein | 2,750 | 19.6 | -1.4 | |
Independent | Ernest Harley | 1,970 | 14.1 | +14.1 | |
Liberal | Paul Scanlan | 1,804 | 12.9 | -20.4 | |
Democratic Labor | Brian Balaam | 361 | 2.6 | -1.4 | |
Independent | William Steer | 35 | 0.3 | +0.3 | |
Total formal votes | 14,001 | 97.6 | -1.5 | ||
Informal votes | 351 | 2.4 | +1.5 | ||
Turnout | 14,352 | 89.3 | -2.8 | ||
Two-party-preferred result | |||||
Country | Cec Carey | 10,530 | 75.2 | +1.6 | |
Labor | William Wollstein | 3,471 | 24.8 | -1.6 | |
Country hold | Swing | +1.6 | |||
Party | Candidate | Votes | % | ± | |
---|---|---|---|---|---|
Country | Cec Carey | 4,624 | 41.7 | -2.7 | |
Liberal | Ernest Harley | 3,686 | 33.3 | +33.3 | |
Labor | H.I. Evans | 2,324 | 21.0 | -0.5 | |
Democratic Labor | P.V. Hallinan | 449 | 4.0 | +4.0 | |
Total formal votes | 11,083 | 99.1 | -0.2 | ||
Informal votes | 105 | 0.9 | +0.2 | ||
Turnout | 11,188 | 92.1 | -1.0 | ||
Two-candidate-preferred result | |||||
Country | Cec Carey | 5,566 | 50.2 | -5.7 | |
Liberal | Ernest Harley | 5,517 | 49.8 | +49.8 | |
Country hold | Swing | -5.7 | |||
Party | Candidate | Votes | % | ± | |
---|---|---|---|---|---|
Country | Cec Carey | 4,191 | 44.4 | +4.8 | |
Independent | Ernest Harley | 3,225 | 34.1 | -2.3 | |
Labor | Eugene Ulrick | 2,026 | 21.5 | -0.9 | |
Total formal votes | 9,442 | 99.3 | +0.3 | ||
Informal votes | 68 | 0.7 | -0.3 | ||
Turnout | 9,510 | 93.1 | +0.2 | ||
Two-candidate-preferred result | |||||
Country | Cec Carey | 5,281 | 55.9 | ||
Independent | Ernest Harley | 4,161 | 44.1 | ||
Country hold | Swing | N/A | |||
Party | Candidate | Votes | % | ± | |
---|---|---|---|---|---|
Country | Cec Carey | 3,277 | 39.6 | ||
Independent | Ernest Harley | 3,017 | 36.4 | ||
Labor | Cecil Jesson | 1,853 | 22.4 | ||
Independent Country | G.D. Plunkett | 132 | 1.6 | ||
Total formal votes | 8,279 | 98.9 | |||
Informal votes | 88 | 1.1 | |||
Turnout | 8,367 | 92.9 | |||
Country win | (new seat) | ||||
Party | Candidate | Votes | % | ± | |
---|---|---|---|---|---|
Country | Thomas Plunkett | 8,090 | 68.6 | +17.8 | |
Labor | J. Cosser | 3,037 | 31.4 | -0.5 | |
Total formal votes | 11,799 | 98.7 | -0.4 | ||
Informal votes | 159 | 1.3 | +0.4 | ||
Turnout | 11,958 | 89.8 | +6.0 | ||
Country hold | Swing | +9.1 | |||
Party | Candidate | Votes | % | ± | |
---|---|---|---|---|---|
Country | Thomas Plunkett | 4,842 | 50.8 | -11.6 | |
Labor | John Rosser | 3,037 | 31.9 | -5.7 | |
Independent Country | Edward Coghlan | 1,654 | 17.3 | +17.3 | |
Total formal votes | 9,533 | 99.1 | +0.8 | ||
Informal votes | 84 | 0.9 | -0.8 | ||
Turnout | 9,617 | 83.8 | -3.5 | ||
Country hold | Swing | -2.9 | |||
Party | Candidate | Votes | % | ± | |
---|---|---|---|---|---|
Country | Thomas Plunkett | 5,617 | 62.4 | +21.9 | |
Labor | John Bray | 3,386 | 37.6 | +9.0 | |
Total formal votes | 9,003 | 98.3 | -0.7 | ||
Informal votes | 156 | 1.7 | +0.7 | ||
Turnout | 9,159 | 87.3 | -5.1 | ||
Country hold | Swing | +7.5 | |||
Party | Candidate | Votes | % | ± | |
---|---|---|---|---|---|
Country | Thomas Plunkett | 3,713 | 40.5 | -13.0 | |
Labor | John Bray | 2,622 | 28.6 | +28.6 | |
Protestant Labor | R.C. Elliott | 1,542 | 16.8 | +16.8 | |
Social Credit | George Gray | 1,289 | 14.1 | -32.4 | |
Total formal votes | 9,166 | 99.0 | +1.9 | ||
Informal votes | 95 | 1.0 | -1.9 | ||
Turnout | 9,261 | 92.4 | +1.0 | ||
Two-party-preferred result | |||||
Country | Thomas Plunkett | 4,195 | 54.9 | +1.5 | |
Labor | John Bray | 3,446 | 45.1 | +45.1 | |
Country hold | Swing | +1.5 | |||
Party | Candidate | Votes | % | ± | |
---|---|---|---|---|---|
CPNP | Thomas Plunkett | 4,452 | 53.5 | -9.8 | |
Social Credit | George Gray | 3,875 | 46.5 | +46.5 | |
Total formal votes | 8,327 | 97.1 | -2.5 | ||
Informal votes | 245 | 2.9 | +2.5 | ||
Turnout | 8,572 | 91.4 | -2.8 | ||
CPNP hold | Swing | -9.8 | |||
Party | Candidate | Votes | % | ± | |
---|---|---|---|---|---|
CPNP | Thomas Plunkett | 4,920 | 63.3 | -9.7 | |
Labor | H.J. Wilson | 2,847 | 36.7 | +9.7 | |
Total formal votes | 7,767 | 99.6 | +0.9 | ||
Informal votes | 33 | 0.4 | -0.9 | ||
Turnout | 7,800 | 94.2 | +4.5 | ||
CPNP hold | Swing | -9.7 | |||
Party | Candidate | Votes | % | ± | |
---|---|---|---|---|---|
CPNP | Thomas Plunkett | 5,446 | 73.0 | +4.2 | |
Labor | Edward Moran | 2,011 | 27.0 | -4.2 | |
Total formal votes | 7,458 | 98.7 | +0.1 | ||
Informal votes | 99 | 1.3 | -0.1 | ||
Turnout | 7,557 | 89.7 | +0.7 | ||
CPNP hold | Swing | +4.2 | |||
Party | Candidate | Votes | % | ± | |
---|---|---|---|---|---|
CPNP | John Appel | 4,736 | 68.8 | -31.2 | |
Labor | W.H. Lake | 2,071 | 30.1 | +30.1 | |
Independent | E.T. Wilkins | 81 | 1.2 | +1.2 | |
Total formal votes | 6,888 | 98.6 | |||
Informal votes | 95 | 1.4 | |||
Turnout | 6,983 | 89.0 | |||
CPNP hold | Swing | -30.6 | |||
Party | Candidate | Votes | % | ± | |
---|---|---|---|---|---|
Country | John Appel | 3,688 | 69.5 | +69.5 | |
Labor | Richard Holden | 1,621 | 30.5 | -7.4 | |
Total formal votes | 5,309 | 99.5 | +0.4 | ||
Informal votes | 26 | 0.5 | -0.4 | ||
Turnout | 5,335 | 80.4 | |||
Country gain from National | Swing | +69.5 |
Party | Candidate | Votes | % | ± | |
---|---|---|---|---|---|
National | John Appel | 2,999 | 62.1 | +62.1 | |
Labor | William Lawson | 1,832 | 37.9 | +37.9 | |
Total formal votes | 4,831 | 99.1 | |||
Informal votes | 43 | 0.9 | |||
Turnout | 4,874 | 80.4 | |||
National gain from Farmers' Union | Swing | +62.1 |
Party | Candidate | Votes | % | ± | |
---|---|---|---|---|---|
Farmers' Union | John Appel | unopposed | |||
Farmers' Union gain from Liberal | Swing | N/A |
Party | Candidate | Votes | % | ± | |
---|---|---|---|---|---|
Liberal | John Appel | unopposed | |||
Liberal hold | Swing | ||||
Antony John Green is an Australian psephologist and commentator. He is the Australian Broadcasting Corporation's election analyst.
Ferny Grove is one of the 89 electoral districts for the Legislative Assembly of Queensland in Australia. Located in northwest Brisbane, it is named for the suburb of Ferny Grove. It was first created in 1992, and was represented by Labor from its creation until the 2012 election, in which the LNP won with a 59.5 percent two-party vote.
The 2015 Queensland state election was held on 31 January 2015 to elect all 89 members of the unicameral Legislative Assembly of Queensland.
This is a list of electoral results for the electoral district of Algester in Queensland state elections.
This is a list of electoral results for the electoral district of Ashgrove in Queensland state elections.
This is a list of electoral results for the electoral district of Barron River in Queensland state elections.
This is a list of electoral results for the electoral district of Bundamba in Queensland state elections.
This is a list of electoral results for the electoral district of Ferny Grove in Queensland state elections.
This is a list of electoral results for the electoral district of Gladstone in the state elections of Queensland, Australia.
This is a list of electoral results for the electoral district of Glass House in Queensland state elections.
This is a list of electoral results for the electoral district of Greenslopes in Queensland state elections.
This is a list of electoral results for the electoral district of Logan in Queensland state elections.
This is a list of electoral results for the electoral district of Mackay in Queensland state elections.
This is a list of electoral results for the electoral district of Mansfield in Queensland state elections.
This is a list of electoral results for the electoral district of Mulgrave in Queensland state elections.
This is a list of electoral results for the electoral district of Mundingburra in Queensland state elections.
This is a list of electoral results for the electoral district of Redcliffe in Queensland state elections.
This is a list of electoral results for the electoral district of Woodridge in Queensland state elections.
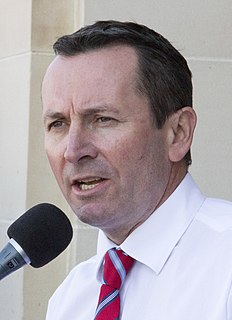
The 2017 Western Australian state election was held on Saturday 11 March 2017 to elect members to the Parliament of Western Australia, including all 59 seats in the Legislative Assembly and all 36 seats in the Legislative Council. The eight-and-a-half-year two-term incumbent Liberal–WA National government, led by Premier Colin Barnett, was defeated in a landslide by the Labor opposition, led by Opposition Leader Mark McGowan.
Macalister is an electoral district of the Legislative Assembly in the Australian state of Queensland. It was created in the 2017 redistribution, and was first contested at the 2017 Queensland state election. It is named after the second Queensland Premier, Arthur Macalister.