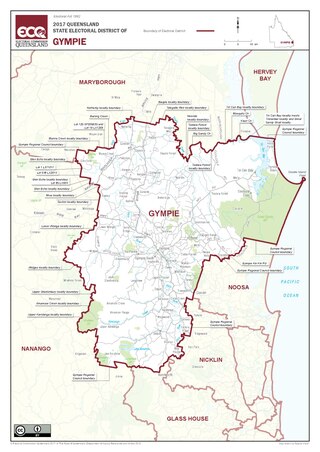
This is a list of electoral results for the electoral district of Gympie in Queensland state elections.
Single member electorate (1873–1888) | |||
---|---|---|---|
Member | Party | Term | |
Robert Lord | Unaligned | 1873–1877 | |
James Kidgell | Unaligned | 1877–1878 | |
John Hamilton | McIlwraith conservative | 1878–1883 | |
William Smyth | Unaligned | 1883–1888 |
Dual member electorate (1888–1912) | |||||||
---|---|---|---|---|---|---|---|
Member | Party | Term | Member | Party | Term | ||
William Smyth | Unaligned | 1888–1899 | Matthew Mellor | Unaligned | 1888–1893 | ||
Andrew Fisher | Labor | 1893–1896 | |||||
Jacob Stumm | Ministerialist | 1896–1899 | |||||
George Ryland | Labor | 1899–1912 | Andrew Fisher | Labor | 1899–1901 | ||
Daniel Mulcahy | Labor | 1901–1912 |
Single member electorate (1912–1950) | |||
---|---|---|---|
Member | Party | Term | |
George Mackay | Ministerialist | 1912–1915 | |
Thomas Dunstan | Labor | 1915–1929 | |
Vivian Tozer | Country and Progressive National | 1929–1935 | |
Thomas Dunstan | Labor | 1935–1950 |
Single member electorate (1960–present) | |||
---|---|---|---|
Member | Party | Term | |
Max Hodges | Country | 1960–1974 | |
National | 1974–1979 | ||
Len Stephan | National | 1979–2001 | |
Elisa Roberts | One Nation | 2001–2002 | |
Independent | 2002–2006 | ||
David Gibson | National | 2006–2008 | |
Liberal National | 2008–2015 | ||
Tony Perrett | Liberal National | 2015–present | |
Party | Candidate | Votes | % | ±% | |
---|---|---|---|---|---|
Liberal National | Tony Perrett | 17,419 | 46.4 | +4.0 | |
Labor | Lachlan Anderson | 8,800 | 23.5 | −5.2 | |
One Nation | Katy McCallum | 8,294 | 22.1 | +9.5 | |
Greens | Emma Buhse | 3,007 | 8.0 | +1.8 | |
Total formal votes | 37,520 | 95.8 | |||
Informal votes | 1,655 | 4.2 | |||
Turnout | 39,175 | ||||
Two-party-preferred result | |||||
Liberal National | Tony Perrett | 24,306 | 64.8 | +6.3 | |
Labor | Lachlan Anderson | 13,214 | 35.2 | −6.3 | |
Liberal National hold | Swing | +6.3 |
Party | Candidate | Votes | % | ±% | |
---|---|---|---|---|---|
Liberal National | Tony Perrett | 14,071 | 42.42 | +5.18 | |
Labor | Geoff Williams | 9,501 | 28.64 | +6.26 | |
One Nation | Michael Blaxland | 4,172 | 12.58 | −17.15 | |
Greens | Lauren Granger-Brown | 2,060 | 6.21 | +0.52 | |
Independent | Tim Jerome | 1,709 | 5.15 | +5.15 | |
Independent | Donna Reardon | 636 | 1.92 | −3.04 | |
Informed Medical Options | Nicholas Fairbairn | 566 | 1.71 | +1.71 | |
Independent | Roland Maertens | 457 | 1.38 | +1.38 | |
Total formal votes | 33,172 | 95.19 | −0.61 | ||
Informal votes | 1,676 | 4.81 | +0.61 | ||
Turnout | 34,848 | 89.03 | −0.69 | ||
Two-party-preferred result | |||||
Liberal National | Tony Perrett | 19,402 | 58.49 | −0.20 | |
Labor | Geoff Williams | 13,770 | 41.51 | +0.20 | |
Liberal National hold | Swing | −0.20 |
Party | Candidate | Votes | % | ±% | |
---|---|---|---|---|---|
Liberal National | Tony Perrett | 11,829 | 37.2 | −4.5 | |
One Nation | Chelle Dobson | 9,444 | 29.7 | +29.0 | |
Labor | Tracey McWilliam | 7,109 | 22.4 | −0.4 | |
Greens | Roxanne Kennedy-Perriman | 1,809 | 5.7 | −0.1 | |
Independent | Donna Reardon | 1,574 | 5.0 | +5.0 | |
Total formal votes | 31,765 | 95.8 | −2.1 | ||
Informal votes | 1,392 | 4.2 | +2.1 | ||
Turnout | 33,157 | 89.7 | +2.5 | ||
Two-candidate-preferred result | |||||
Liberal National | Tony Perrett | 18,640 | 58.7 | +0.5 | |
One Nation | Chelle Dobson | 13,125 | 41.3 | +41.3 | |
Liberal National hold | Swing | +0.5 |
Party | Candidate | Votes | % | ±% | |
---|---|---|---|---|---|
Liberal National | Tony Perrett | 12,366 | 41.30 | −11.72 | |
Labor | Stephen Meredith | 6,971 | 23.28 | +11.04 | |
Katter's Australian | Shane Paulger | 4,804 | 16.05 | −5.79 | |
Palmer United | Mitchell Frost | 3,384 | 11.30 | +11.30 | |
Greens | Shena Macdonald | 2,414 | 8.06 | −0.43 | |
Total formal votes | 29,939 | 97.80 | −0.04 | ||
Informal votes | 673 | 2.20 | +0.04 | ||
Turnout | 30,612 | 91.52 | −1.01 | ||
Two-party-preferred result | |||||
Liberal National | Tony Perrett | 13,833 | 57.10 | −10.16 | |
Labor | Stephen Meredith | 10,394 | 42.90 | +10.16 | |
Liberal National hold | Swing | −10.16 |
Party | Candidate | Votes | % | ±% | |
---|---|---|---|---|---|
Liberal National | David Gibson | 15,054 | 53.03 | −7.60 | |
Katter's Australian | Shane Paulger | 6,198 | 21.83 | +21.83 | |
Labor | Ben Parker | 3,475 | 12.24 | −2.41 | |
Greens | Shena MacDonald | 2,410 | 8.49 | −1.90 | |
Family First | Kathy Hawke | 917 | 3.23 | +3.23 | |
One Nation | Santo Ferraro | 335 | 1.18 | +1.18 | |
Total formal votes | 28,389 | 97.84 | −0.02 | ||
Informal votes | 627 | 2.16 | +0.02 | ||
Turnout | 29,016 | 92.53 | +0.47 | ||
Two-candidate-preferred result | |||||
Liberal National | David Gibson | 16,194 | 67.26 | −9.95 | |
Katter's Australian | Shane Paulger | 7,883 | 32.74 | +32.74 | |
Liberal National hold | Swing | −9.95 |
Party | Candidate | Votes | % | ±% | |
---|---|---|---|---|---|
Liberal National | David Gibson | 16,612 | 60.6 | +14.7 | |
Labor | Daniel Tabone | 4,013 | 14.6 | +2.9 | |
Independent | Elisa Roberts | 3,928 | 14.3 | +5.3 | |
Greens | Kent Hutton | 2,847 | 10.4 | +1.8 | |
Total formal votes | 27,400 | 97.6 | |||
Informal votes | 599 | 2.4 | |||
Turnout | 27,999 | 92.1 | |||
Two-party-preferred result | |||||
Liberal National | David Gibson | 18,057 | 77.2 | +5.2 | |
Labor | Daniel Tabone | 5,331 | 22.8 | −5.2 | |
Liberal National hold | Swing | +5.2 |
Party | Candidate | Votes | % | ±% | |
---|---|---|---|---|---|
National | David Gibson | 13,054 | 46.0 | +21.1 | |
Independent | Rae Gate | 3,857 | 13.6 | +13.6 | |
Labor | Jon Persley | 3,508 | 12.4 | −13.3 | |
Greens | Paul Marshall | 2,598 | 9.2 | +5.3 | |
Independent | Elisa Roberts | 2,393 | 8.4 | −25.0 | |
Family First | Beryl Spencer | 2,317 | 8.2 | +8.2 | |
One Nation | Greg Houghton | 647 | 2.3 | −3.3 | |
Total formal votes | 28,374 | 98.1 | −0.4 | ||
Informal votes | 543 | 1.9 | +0.4 | ||
Turnout | 28,917 | 92.3 | −0.5 | ||
Two-candidate-preferred result | |||||
National | David Gibson | 15,469 | 68.2 | +68.2 | |
Independent | Rae Gate | 7,199 | 31.8 | +31.8 | |
National gain from Independent | Swing | N/A |
Party | Candidate | Votes | % | ±% | |
---|---|---|---|---|---|
Independent | Elisa Roberts | 9,031 | 33.4 | +33.4 | |
Labor | Rae Gate | 6,946 | 25.7 | −7.7 | |
National | Christian Rowan | 6,718 | 24.9 | +0.2 | |
Independent | Wayne Sachs | 1,675 | 6.2 | +6.2 | |
One Nation | Colin Bailey | 1,508 | 5.6 | −20.1 | |
Greens | Glenda Stasse | 1,049 | 3.9 | +3.9 | |
Independent | Martin Poole | 77 | 0.3 | +0.3 | |
Total formal votes | 27,004 | 98.5 | +0.0 | ||
Informal votes | 414 | 1.5 | −0.0 | ||
Turnout | 27,418 | 92.8 | −0.9 | ||
Two-candidate-preferred result | |||||
Independent | Elisa Roberts | 12,285 | 60.1 | +60.1 | |
Labor | Rae Gate | 8,172 | 39.9 | −6.8 | |
Independent gain from One Nation | Swing | N/A |
Party | Candidate | Votes | % | ±% | |
---|---|---|---|---|---|
Labor | Rae Gate | 8,563 | 33.4 | +7.4 | |
One Nation | Elisa Roberts | 6,587 | 25.7 | −11.7 | |
National | Stephen Duff | 6,330 | 24.7 | −3.7 | |
City Country Alliance | Ian Petersen | 4,139 | 16.2 | +16.2 | |
Total formal votes | 25,619 | 98.5 | |||
Informal votes | 399 | 1.5 | |||
Turnout | 26,018 | 93.7 | |||
Two-candidate-preferred result | |||||
One Nation | Elisa Roberts | 11,130 | 53.3 | +6.8 | |
Labor | Rae Gate | 9,766 | 46.7 | +46.7 | |
One Nation gain from National | Swing | +6.8 |
Party | Candidate | Votes | % | ±% | |
---|---|---|---|---|---|
One Nation | Ian Petersen | 8,745 | 39.2 | +39.2 | |
National | Len Stephan | 6,971 | 31.3 | −23.3 | |
Labor | David Warren | 5,806 | 26.1 | −4.7 | |
Greens | Chris Gwin | 764 | 3.4 | +3.4 | |
Total formal votes | 22,286 | 98.7 | +0.1 | ||
Informal votes | 284 | 1.3 | −0.1 | ||
Turnout | 22,570 | 93.8 | +0.9 | ||
Two-candidate-preferred result | |||||
National | Len Stephan | 10,486 | 51.7 | −10.9 | |
One Nation | Ian Petersen | 9,796 | 48.3 | +48.3 | |
National hold | Swing | −10.9 |
Party | Candidate | Votes | % | ±% | |
---|---|---|---|---|---|
National | Len Stephan | 11,247 | 54.6 | +14.6 | |
Labor | David Warren | 6,339 | 30.8 | −4.7 | |
Independent | Inge Schilling | 1,608 | 7.8 | +7.8 | |
Democrats | Peter Sykes | 1,397 | 6.8 | +6.8 | |
Total formal votes | 20,591 | 98.7 | +0.2 | ||
Informal votes | 278 | 1.3 | −0.2 | ||
Turnout | 20,869 | 92.9 | |||
Two-party-preferred result | |||||
National | Len Stephan | 12,467 | 62.6 | +5.0 | |
Labor | David Warren | 7,450 | 37.4 | −5.0 | |
National hold | Swing | +5.0 |
Party | Candidate | Votes | % | ±% | |
---|---|---|---|---|---|
National | Len Stephan | 7,921 | 40.0 | +6.9 | |
Labor | Geoffrey Brown | 7,026 | 35.5 | −1.6 | |
Independent | Bruce Chapman | 2,589 | 13.1 | +6.5 | |
Liberal | John Cotter | 2,256 | 11.4 | +2.3 | |
Total formal votes | 19,792 | 98.4 | |||
Informal votes | 315 | 1.6 | |||
Turnout | 20,107 | 92.9 | |||
Two-party-preferred result | |||||
National | Len Stephan | 10,873 | 57.6 | +1.8 | |
Labor | Geoffrey Brown | 7,993 | 42.4 | −1.8 | |
National hold | Swing | +1.8 |
Party | Candidate | Votes | % | ±% | |
---|---|---|---|---|---|
Labor | Geoffrey Brown | 5,376 | 35.6 | +3.3 | |
National | Len Stephan | 5,076 | 33.6 | −23.8 | |
Independent | Adrian McClintock | 2,173 | 14.4 | +14.4 | |
Independent | Bruce Chapman | 1,179 | 7.8 | +7.8 | |
Liberal | Bruce Kean | 1,144 | 7.6 | −2.8 | |
United People | Lewis Blayse | 147 | 1.0 | +1.0 | |
Total formal votes | 15,095 | 97.0 | −1.5 | ||
Informal votes | 463 | 3.0 | −1.5 | ||
Turnout | 15,558 | 92.2 | −0.8 | ||
Two-party-preferred result | |||||
National | Len Stephan | 8,603 | 57.0 | −7.8 | |
Labor | Geoffrey Brown | 6,492 | 43.0 | +7.8 | |
National hold | Swing | −7.8 |
Party | Candidate | Votes | % | ±% | |
---|---|---|---|---|---|
National | Len Stephan | 7,830 | 57.4 | −7.1 | |
Labor | Sven Condon | 4,404 | 32.3 | −3.2 | |
Liberal | Bruce Kean | 1,415 | 10.4 | +10.4 | |
Total formal votes | 13,649 | 98.5 | −0.4 | ||
Informal votes | 211 | 1.5 | +0.4 | ||
Turnout | 13,860 | 93.0 | −0.5 | ||
Two-party-preferred result | |||||
National | Len Stephan | 8,845 | 64.8 | +0.3 | |
Labor | Sven Condon | 4,804 | 35.2 | −0.3 | |
National hold | Swing | +0.3 |
Party | Candidate | Votes | % | ±% | |
---|---|---|---|---|---|
National | Len Stephan | 8,964 | 64.5 | +10.8 | |
Labor | Thomas Barnett | 4,940 | 35.5 | +9.6 | |
Total formal votes | 13,904 | 98.9 | −0.2 | ||
Informal votes | 159 | 1.1 | +0.2 | ||
Turnout | 14,063 | 93.5 | −1.3 | ||
National hold | Swing | −3.8 |
Party | Candidate | Votes | % | ±% | |
---|---|---|---|---|---|
National | Len Stephan | 6,679 | 53.7 | −7.8 | |
Labor | Reginald Lawler | 3,216 | 25.9 | −2.1 | |
Liberal | Minas Venardos | 2,131 | 17.1 | +17.1 | |
Progress | William Runge | 412 | 3.3 | −7.2 | |
Total formal votes | 12,438 | 99.1 | 0.0 | ||
Informal votes | 106 | 0.9 | 0.0 | ||
Turnout | 12,544 | 94.8 | +1.0 | ||
Two-party-preferred result | |||||
National | Len Stephan | 8,492 | 68.3 | −0.5 | |
Labor | Reginald Lawler | 3,946 | 31.7 | +0.5 | |
National hold | Swing | −0.5 |
Party | Candidate | Votes | % | ±% | |
---|---|---|---|---|---|
National | Max Hodges | 7,097 | 61.5 | −12.1 | |
Labor | Reginald Lawler | 3,232 | 28.0 | +1.6 | |
Progress | William Runge | 1,211 | 10.5 | +10.5 | |
Total formal votes | 11,540 | 99.1 | |||
Informal votes | 106 | 0.9 | |||
Turnout | 11,646 | 93.8 | |||
Two-party-preferred result | |||||
National | Max Hodges | 7,945 | 68.8 | −4.8 | |
Labor | Reginald Lawler | 3,595 | 31.2 | +4.8 | |
National hold | Swing | −4.8 |
Party | Candidate | Votes | % | ±% | |
---|---|---|---|---|---|
National | Max Hodges | 7,942 | 73.6 | +19.9 | |
Labor | N. Box | 2,850 | 26.4 | −11.6 | |
Total formal votes | 10,792 | 98.5 | −0.6 | ||
Informal votes | 163 | 1.5 | +0.6 | ||
Turnout | 10,955 | 93.6 | +0.2 | ||
National hold | Swing | +13.9 |
Party | Candidate | Votes | % | ±% | |
---|---|---|---|---|---|
Country | Max Hodges | 5,407 | 53.7 | −4.6 | |
Labor | Alex Pringle | 3,830 | 38.0 | +6.9 | |
Queensland Labor | Benedict Kehoe | 572 | 5.7 | +0.2 | |
Independent | Cecil Rivers | 260 | 2.6 | −1.4 | |
Total formal votes | 9,611 | 98.1 | |||
Informal votes | 184 | 1.9 | |||
Turnout | 9,795 | 94.9 | |||
Two-party-preferred result | |||||
Country | Max Hodges | 6,012 | 59.7 | +5.2 | |
Labor | Alex Pringle | 4,057 | 40.3 | −5.2 | |
Country hold | Swing | +5.2 |
Party | Candidate | Votes | % | ±% | |
---|---|---|---|---|---|
Country | Max Hodges | 5,608 | 58.3 | +1.0 | |
Labor | Jack Ison | 2,992 | 31.1 | −4.7 | |
Queensland Labor | Denis Tanner | 525 | 5.5 | −1.4 | |
Independent | Cecil Rivers | 388 | 4.0 | +4.0 | |
Independent | Bernard Thomas | 98 | 1.0 | +1.0 | |
Total formal votes | 9,611 | 98.1 | −1.0 | ||
Informal votes | 184 | 1.9 | +1.0 | ||
Turnout | 9,795 | 94.9 | −1.0 | ||
Two-party-preferred result | |||||
Country | Max Hodges | 6,278 | 65.3 | +2.4 | |
Labor | Jack Ison | 3,333 | 34.7 | −2.4 | |
Country hold | Swing | +2.4 |
Party | Candidate | Votes | % | ±% | |
---|---|---|---|---|---|
Country | Max Hodges | 5,489 | 57.3 | +0.2 | |
Labor | Marcus Dower | 3,432 | 35.8 | +2.3 | |
Queensland Labor | Denis Tanner | 664 | 6.9 | −2.5 | |
Total formal votes | 9,585 | 99.1 | 0.0 | ||
Informal votes | 90 | 0.9 | 0.0 | ||
Turnout | 9,675 | 95.9 | −0.1 | ||
Two-party-preferred result | |||||
Country | Max Hodges | 6,029 | 62.9 | −1.8 | |
Labor | Marcus Dower | 3,556 | 37.1 | +1.8 | |
Country hold | Swing | −1.8 |
Party | Candidate | Votes | % | ±% | |
---|---|---|---|---|---|
Country | Max Hodges | 5,477 | 57.1 | −1.0 | |
Labor | Blair Jamieson | 3,213 | 33.5 | +3.3 | |
Queensland Labor | Denis Tanner | 897 | 9.4 | −2.3 | |
Total formal votes | 9,587 | 99.1 | −0.1 | ||
Informal votes | 85 | 0.9 | +0.1 | ||
Turnout | 9,672 | 96.0 | +0.4 | ||
Two-party-preferred result | |||||
Country | Max Hodges | 6,207 | 64.7 | ||
Labor | Blair Jamieson | 3,380 | 35.3 | ||
Country hold | Swing | N/A |
Party | Candidate | Votes | % | ±% | |
---|---|---|---|---|---|
Country | Max Hodges | 5,616 | 58.1 | ||
Labor | Blair Jamieson | 2,920 | 30.2 | ||
Queensland Labor | Denis Tanner | 1,129 | 11.7 | ||
Total formal votes | 9,665 | 99.2 | |||
Informal votes | 75 | 0.8 | |||
Turnout | 9,740 | 95.6 | |||
Country win | (new seat) |
Party | Candidate | Votes | % | ±% | |
---|---|---|---|---|---|
Labor | Thomas Dunstan | 3,116 | 41.7 | −6.1 | |
People's Party | Ronald Witham | 3,054 | 40.8 | −2.9 | |
Frank Barnes Labor | Ray Smith | 875 | 11.7 | +11.7 | |
Independent | Eric Grice | 437 | 5.8 | +5.8 | |
Total formal votes | 7,482 | 99.6 | +0.1 | ||
Informal votes | 28 | 0.4 | −0.1 | ||
Turnout | 7,510 | 92.5 | +4.5 | ||
Labor hold | Swing | −1.7 |
Party | Candidate | Votes | % | ±% | |
---|---|---|---|---|---|
Labor | Thomas Dunstan | 3,197 | 47.8 | −4.6 | |
People's Party | Niels Damm | 2,923 | 43.7 | +13.7 | |
Independent | William Ebrington | 572 | 8.5 | +8.5 | |
Total formal votes | 6,692 | 99.5 | 0.0 | ||
Informal votes | 33 | 0.5 | 0.0 | ||
Turnout | 6,725 | 88.0 | −5.3 | ||
Labor hold | Swing | −11.4 |
Party | Candidate | Votes | % | ±% | |
---|---|---|---|---|---|
Labor | Thomas Dunstan | 3,738 | 52.4 | +9.4 | |
United Australia | Ronald Witham | 2,142 | 30.0 | +30.0 | |
Country | William Kidd | 1,251 | 17.5 | −4.1 | |
Total formal votes | 7,131 | 99.5 | +0.2 | ||
Informal votes | 39 | 0.5 | −0.2 | ||
Turnout | 7,170 | 93.3 | −0.4 | ||
Labor hold | Swing | N/A |
Party | Candidate | Votes | % | ±% | |
---|---|---|---|---|---|
Labor | Thomas Dunstan | 3,040 | 43.0 | −13.7 | |
Protestant Labor | William Millett | 2,264 | 32.0 | +32.0 | |
Country | Vivian Tozer | 1,526 | 21.6 | −21.7 | |
Social Credit | Alfred Taylor | 246 | 3.5 | +3.5 | |
Total formal votes | 7,076 | 99.3 | +0.2 | ||
Informal votes | 51 | 0.7 | −0.2 | ||
Turnout | 7,127 | 93.7 | −0.5 | ||
Two-candidate-preferred result | |||||
Labor | Thomas Dunstan | 3,203 | 55.3 | −1.4 | |
Protestant Labor | William Millett | 2,590 | 44.7 | +44.7 | |
Labor hold | Swing | N/A |
Party | Candidate | Votes | % | ±% | |
---|---|---|---|---|---|
Labor | Thomas Dunstan | 4,105 | 56.7 | ||
CPNP | Vivian Tozer | 3,138 | 43.3 | ||
Total formal votes | 7,243 | 99.1 | |||
Informal votes | 68 | 0.9 | |||
Turnout | 7,311 | 94.2 | |||
Labor gain from CPNP | Swing |
Party | Candidate | Votes | % | ±% | |
---|---|---|---|---|---|
CPNP | Vivian Tozer | 4,116 | 51.5 | ||
Labor | Thomas Dunstan | 3,869 | 48.5 | ||
Total formal votes | 7,985 | 99.5 | |||
Informal votes | 36 | 0.5 | |||
Turnout | 8,021 | 94.1 | |||
CPNP hold | Swing |
Party | Candidate | Votes | % | ±% | |
---|---|---|---|---|---|
CPNP | Vivian Tozer | 2,548 | 54.5 | +11.5 | |
Labor | Thomas Dunstan | 2,125 | 45.5 | −11.5 | |
Total formal votes | 4,673 | ||||
Informal votes | |||||
Turnout | |||||
CPNP gain from Labor | Swing | +11.5 |
Party | Candidate | Votes | % | ±% | |
---|---|---|---|---|---|
Labor | Thomas Dunstan | 2,795 | 57.0 | +0.9 | |
CPNP | Henry Cowie | 2,108 | 43.0 | −0.9 | |
Total formal votes | 4,903 | 99.1 | −0.3 | ||
Informal votes | 44 | 0.9 | +0.3 | ||
Turnout | 4,947 | 93.2 | +5.4 | ||
Labor hold | Swing | +0.9 |
Party | Candidate | Votes | % | ±% | |
---|---|---|---|---|---|
Labor | Thomas Dunstan | 2,598 | 56.1 | +1.3 | |
Country | Henry Cowie | 2,033 | 43.9 | +43.9 | |
Total formal votes | 4,631 | 99.4 | +0.6 | ||
Informal votes | 27 | 0.6 | −0.6 | ||
Turnout | 4,658 | 87.8 | 0.0 | ||
Labor hold | Swing | +1.3 |
Party | Candidate | Votes | % | ±% | |
---|---|---|---|---|---|
Labor | Thomas Dunstan | 1,863 | 54.8 | −1.9 | |
National | James MacDonnell | 1,539 | 45.2 | +1.9 | |
Total formal votes | 3,402 | 98.8 | −0.2 | ||
Informal votes | 42 | 1.2 | +0.2 | ||
Turnout | 3,444 | 87.8 | +0.6 | ||
Labor hold | Swing | −1.9 |
Party | Candidate | Votes | % | ±% | |
---|---|---|---|---|---|
Labor | Thomas Dunstan | 2,076 | 56.7 | +4.0 | |
National | Alexander Glasgow | 1,585 | 43.3 | −4.0 | |
Total formal votes | 3,661 | 99.0 | +0.5 | ||
Informal votes | 36 | 1.0 | −0.5 | ||
Turnout | 3,697 | 87.2 | −5.5 | ||
Labor hold | Swing | +4.0 |
Party | Candidate | Votes | % | ±% | |
---|---|---|---|---|---|
Labor | Thomas Dunstan | 1,874 | 52.7 | +10.6 | |
Liberal | George Mackay | 1,683 | 47.3 | +1.6 | |
Total formal votes | 3,557 | 98.5 | −0.2 | ||
Informal votes | 53 | 1.5 | +0.2 | ||
Turnout | 3,610 | 92.7 | +12.6 | ||
Labor gain from Liberal | Swing | +5.4 |
Party | Candidate | Votes | % | ±% | |
---|---|---|---|---|---|
Liberal | George Mackay | 1,529 | 45.7 | ||
Labor | George Ryland | 1,409 | 42.1 | ||
Independent Labor | Daniel Mulcahy | 407 | 12.2 | ||
Total formal votes | 3,345 | 98.7 | |||
Informal votes | 44 | 1.3 | |||
Turnout | 3,389 | 80.1 | |||
Two-party-preferred result | |||||
Liberal | George Mackay | 1,581 | 52.7 | ||
Labor | George Ryland | 1,417 | 47.3 | ||
Liberal gain from Labor | Swing |
Gympie is an electoral district of the Legislative Assembly in the Australian state of Queensland The electorate is centred on the city of Gympie and stretches north to Rainbow Beach and as far south to Pomona.
This is a list of electoral results for the electoral district of Burnett in Queensland state elections.
This is a list of electoral results for the electoral district of Callide in Queensland state elections.
This is a list of electoral results for the electoral district of Caloundra in Queensland state elections.
This is a list of electoral results for the electoral district of Chatsworth in Queensland state elections.
This is a list of electoral results for the electoral district of Condamine in Queensland state elections.
This is a list of electoral results for the electoral district of Cook in Queensland state elections.
This is a list of electoral results for the electoral district of Coomera in Queensland state elections.
This is a list of electoral results for the electoral district of Currumbin in Queensland state elections.
This is a list of electoral results for the electoral district of Everton in Queensland state elections.
This is a list of electoral results for the electoral district of Ferny Grove in Queensland state elections.
This is a list of electoral results for the electoral district of Gaven in Queensland state elections.
This is a list of electoral results for the electoral district of Gladstone in the state elections of Queensland, Australia.
This is a list of electoral results for the electoral district of Greenslopes in Queensland state elections.
This is a list of electoral results for the electoral district of Gregory in Queensland state elections.
This is a list of electoral results for the electoral district of Hervey Bay in Queensland state elections.
This is a list of electoral results for the electoral district of Inala in Queensland state elections.
This is a list of electoral results for the electoral district of Ipswich in Queensland state elections.
This is a list of electoral results for the electoral district of Nanango in Queensland state elections.
This is a list of election results for the 2020 Queensland state election.