Electoral results for the district of Callide

Last updated

This is a list of electoral results for the electoral district of Callide in Queensland state elections.

Contents

Members for Callide

MemberPartyTerm
  Vince Jones Country 1950–1971
  Lindsay Hartwig Country 1972–1974
  National 1974–1981
  Independent 1981–1986
  Di McCauley National 1986–1998
  Jeff Seeney National 1998–2008
  Liberal National 2008–2017
  Colin Boyce Liberal National 2017–2022
  Bryson Head Liberal National 2022–present

Election results

Elections in the 2020s

2022 Callide state by-election [1]
PartyCandidateVotes%±%
Liberal National Bryson Head 13,05950.33−6.87
Labor Bronwyn Dendle5,02019.35−6.35
One Nation Sharon Lohse3,70414.28+14.28
Katter's Australian Adam Burling2,5179.70+1.29 [lower-alpha 1]
Legalise Cannabis Fabrice Jarry1,2234.71+4.71
Animal Justice Paula Gilbard4241.63+1.63
Total formal votes25,94798.11+1.08
Informal votes5001.89−1.08
Turnout 26,12775.81−14.27
Two-party-preferred result
Liberal National Bryson Head 18,61171.73+5.90
Labor Bronwyn Dendle7,33628.27−5.90
Liberal National hold Swing +5.90
  1. Counted from Burling's vote share as an independent candidate in 2020.
2020 Queensland state election: Callide [2]
PartyCandidateVotes%±%
Liberal National Colin Boyce 16,60857.20+23.77
Labor Gordon Earnshaw7,46325.71+3.55
Independent Adam Burling2,4448.42+8.42
Independent Loris Doessel1,3714.72+4.72
Greens Anthony Walsh1,1473.95+0.54
Total formal votes29,03397.04+0.67
Informal votes8872.96−0.67
Turnout 29,92088.24−1.19
Two-party-preferred result
Liberal National Colin Boyce 19,11265.83+9.71
Labor Gordon Earnshaw9,92134.17+34.17
Liberal National hold 

Elections in the 2010s

2017 Queensland state election: Callide [3]
PartyCandidateVotes%±%
Liberal National Colin Boyce 9,66333.4−11.5
One Nation Sharon Lohse7,40825.6+25.6
Labor Darren Blackwood6,40422.2−1.4
Katter's Australian Robbie Radel3,76113.0+13.0
Greens Jaiben Baker9873.4+0.5
Independent Sandra Anderson6822.4+2.4
Total formal votes28,90596.4−1.8
Informal votes1,0893.6+1.8
Turnout 29,99489.4−1.8
Two-candidate-preferred result
Liberal National Colin Boyce 16,22056.1−3.7
One Nation Sharon Lohse12,68543.9+43.9
Liberal National hold Swing −3.7
2015 Queensland state election: Callide [4]
PartyCandidateVotes%±%
Liberal National Jeff Seeney 12,81546.50−6.83
Palmer United John Bjelke-Petersen6,94425.20+25.20
Labor Graeme Martin5,31219.28+4.52
Greens Erich Schulz8483.08−0.17
Independent Steve Ensby7182.61+2.61
Independent Michael Higginson5381.95+1.95
Independent Duncan Scott3841.39−0.67
Total formal votes27,55998.40−0.07
Informal votes4491.60+0.07
Turnout 28,00891.98−0.34
Two-candidate-preferred result
Liberal National Jeff Seeney 13,44456.67−6.84
Palmer United John Bjelke-Petersen10,28043.33+43.33
Liberal National hold Swing −6.84
2012 Queensland state election: Callide [5]
PartyCandidateVotes%±%
Liberal National Jeff Seeney 14,66653.33-5.65
Katter's Australian Steve Ensby7,31826.61+26.61
Labor Melissa Newton4,05814.76-9.16
Greens Camilla Percy8923.24-0.59
Independent Duncan Scott5672.06+2.06
Total formal votes27,50198.46-0.13
Informal votes3971.54+0.13
Turnout 27,50192.32-0.57
Two-candidate-preferred result
Liberal National Jeff Seeney 15,22463.51-5.85
Katter's Australian Steve Ensby8,74736.49+36.49
Liberal National hold Swing -5.85

Elections in the 2000s

2009 Queensland state election: Callide [6]
PartyCandidateVotes%±%
Liberal National Jeff Seeney 16,36559.0-11.2
Labor David Pullen6,63623.9-5.6
Independent Clare Mildren3,68013.3+13.3
Greens Camilla Percy1,0643.8+3.8
Total formal votes27,74598.5
Informal votes3971.5
Turnout 28,14292.9
Two-party-preferred result
Liberal National Jeff Seeney 17,53769.4-1.0
Labor David Pullen7,74630.6+1.0
Liberal National hold Swing -1.0
2006 Queensland state election: Callide
PartyCandidateVotes%±%
National Jeff Seeney 17,02272.3+11.9
Labor Mikey Oliver6,52727.7+5.9
Total formal votes23,54997.5-0.8
Informal votes5972.5+0.8
Turnout 24,14692.0-1.6
National hold Swing -1.3
2004 Queensland state election: Callide
PartyCandidateVotes%±%
National Jeff Seeney 14,45860.4+20.3
Labor David Pullen5,21621.8-2.0
One Nation Jim Dwyer4,26417.8-18.3
Total formal votes23,93898.3-0.0
Informal votes4051.7+0.0
Turnout 24,34393.6-0.3
Two-party-preferred result
National Jeff Seeney 16,22373.6+21.3
Labor David Pullen5,82026.4+26.4
National hold Swing +21.3
2001 Queensland state election: Callide
PartyCandidateVotes%±%
National Jeff Seeney 9,59840.1+4.8
One Nation Jim Dwyer8,64836.1-3.7
Labor Peter Allen5,69423.8+5.1
Total formal votes23,94098.3
Informal votes4241.7
Turnout 24,36493.9
Two-candidate-preferred result
National Jeff Seeney 10,26552.3+2.8
One Nation Jim Dwyer9,35547.7-2.8
National hold Swing +2.8

Elections in the 1990s

1998 Queensland state election: Callide
PartyCandidateVotes%±%
National Jeff Seeney 6,59737.7-36.7
One Nation Chris Savage6,56637.5+37.5
Labor Gary Barton3,33519.0-1.7
Australia First Dolores Fowler1,0135.8+5.8
Total formal votes17,51199.0+0.1
Informal votes1751.0-0.1
Turnout 17,68695.2+0.3
Two-candidate-preferred result
National Jeff Seeney 8,43252.3-25.5
One Nation Chris Savage7,69647.7+47.7
National hold Swing -25.5
1995 Queensland state election: Callide
PartyCandidateVotes%±%
National Di McCauley 13,21374.4+8.7
Labor Katrina McGill3,69320.8+20.8
Confederate Action Anthony May8584.8-11.2
Total formal votes17,76498.9+0.9
Informal votes1931.1-0.9
Turnout 17,95794.9
Two-party-preferred result
National Di McCauley 13,70677.7+1.8
Labor Katrina McGill3,92522.3+22.3
National hold Swing +1.8
1992 Queensland state election: Callide
PartyCandidateVotes%±%
National Di McCauley 11,92765.6+7.0
Independent Tom Knight3,34018.4+18.4
Confederate Action Anthony May2,90416.0+16.0
Total formal votes18,17198.1
Informal votes3591.9
Turnout 18,53093.8
Two-candidate-preferred result
National Di McCauley 13,15075.9+8.9
Independent Tom Knight4,17224.1+24.1
National hold Swing +8.9

Elections in the 1980s

1989 Queensland state election: Callide
PartyCandidateVotes%±%
National Di McCauley 7,36554.3+4.4
Labor Greg Clair6,20145.7+16.7
Total formal votes13,56697.0-1.5
Informal votes4213.0+1.5
Turnout 13,98792.0+0.4
National hold Swing -8.9
1986 Queensland state election: Callide
PartyCandidateVotes%±%
National Di McCauley 5,95049.9+10.6
Labor Nick Kofoed3,46229.0+3.7
Independent Barry James1,49612.6+12.6
Liberal Geoffrey Clarke1,0138.5+8.5
Total formal votes11,92198.5-0.6
Informal votes1851.5+0.6
Turnout 12,10691.6-1.0
Two-party-preferred result
National Di McCauley 7,53463.2+22.5
Labor Nick Kofoed4,38736.8+36.8
National gain from Independent Swing +22.5
1983 Queensland state election: Callide
PartyCandidateVotes%±%
National Alan Stevenson5,81739.3-26.5
Independent Lindsay Hartwig 5,24935.4+35.4
Labor Alan Morris3,74625.3-8.9
Total formal votes14,81299.1+0.7
Informal votes1350.9-0.7
Turnout 14,94792.6+1.5
Two-candidate-preferred result
Independent Lindsay Hartwig 8,78559.3+59.3
National Alan Stevenson6,02740.7-25.1
Independent gain from National Swing N/A
1980 Queensland state election: Callide
PartyCandidateVotes%±%
National Lindsay Hartwig 8,25265.8+0.5
Labor Alan Morris4,29334.2-0.5
Total formal votes12,54598.4-0.3
Informal votes2031.6+0.3
Turnout 12,74891.1-0.7
National hold Swing +0.5

Elections in the 1970s

1977 Queensland state election: Callide
PartyCandidateVotes%±%
National Lindsay Hartwig 7,38365.3-2.4
Labor John O'Sullivan3,92834.7+6.2
Total formal votes11,31198.7
Informal votes1491.3
Turnout 11,46091.8
National hold Swing -5.5
1974 Queensland state election: Callide
PartyCandidateVotes%±%
National Lindsay Hartwig 7,24367.7+17.4
Labor Mabel Edmund1,95718.3+18.3
Labor Wilfred Mutton1,09610.2+10.2
Queensland Labor Lindsay Sharpe4073.8-8.2
Total formal votes10,70398.3-0.3
Informal votes1811.7+0.3
Turnout 10,88491.0-2.9
Two-party-preferred result
National Lindsay Hartwig 7,58170.8+10.5
Labor Mabel Edmund3,12229.2-10.5
National hold Swing +10.5
1972 Queensland state election: Callide
PartyCandidateVotes%±%
Country Lindsay Hartwig 4,68250.3+7.1
Labor Charles Tutt3,51137.7+1.2
Queensland Labor Edgar Lanigan1,11812.0+1.9
Total formal votes9,31198.6
Informal votes1351.4
Turnout 9,44693.9
Two-party-preferred result
Country Lindsay Hartwig 5,61160.3+3.5
Labor Charles Tutt3,70039.7-3.5
Country hold Swing +3.5

Elections in the 1960s

1969 Queensland state election: Callide
PartyCandidateVotes%±%
Country Vincent Jones 3,83043.2-10.6
Labor Charles Tutt3,23636.5+3.3
Independent Edgar Shields90410.2+10.2
Queensland Labor Edgar Lanigan89210.1-2.9
Total formal votes8,86298.6-0.1
Informal votes1251.4+0.1
Turnout 8,98792.0-1.7
Two-party-preferred result
Country Vincent Jones 5,03056.8-7.6
Labor Charles Tutt3,83243.2+7.6
Country hold Swing -7.6
1966 Queensland state election: Callide
PartyCandidateVotes%±%
Country Vincent Jones 4,54753.8+8.3
Labor Wilfred Prisgrove2,80933.2+1.4
Queensland Labor Edgar Lanigan1,10213.0+7.5
Total formal votes8,45898.7+0.1
Informal votes1151.3-0.1
Turnout 8,57393.7-1.4
Two-party-preferred result
Country Vincent Jones 5,44464.4+1.1
Labor Wilfred Prisgrove3,01435.6-1.1
Country hold Swing +1.1
1963 Queensland state election: Callide
PartyCandidateVotes%±%
Country Vincent Jones 3,74545.4-16.9
Labor Keith Coombs2,62231.8-5.9
Independent Alfred O'Rouke1,42217.3+17.3
Queensland Labor Nancy Green4515.5+5.5
Total formal votes8,24098.60.0
Informal votes1191.40.0
Turnout 8,35995.1+2.2
Two-party-preferred result
Country Vincent Jones 5,21763.3+1.0
Labor Keith Coombs3,02336.7-1.0
Country hold Swing +1.0
1960 Queensland state election: Callide
PartyCandidateVotes%±%
Country Vincent Jones 4,99862.3
Labor Oliver Edwards3,02237.7
Total formal votes8,02098.6
Informal votes1141.4
Turnout 8,13492.9
Country hold Swing

Elections in the 1950s

1957 Queensland state election: Callide
PartyCandidateVotes%±%
Country Vincent Jones unopposed
Country hold Swing
1956 Queensland state election: Callide
PartyCandidateVotes%±%
Country Vincent Jones 6,39665.1+1.2
Labor Eric Willis3,43534.9-1.2
Total formal votes9,83198.8+1.7
Informal votes1161.2-1.7
Turnout 9,94795.0-1.9
Country hold Swing +1.2
1953 Queensland state election: Callide
PartyCandidateVotes%±%
Country Vincent Jones 5,98863.9-1.9
Labor Patrick Moore3,38636.1+1.9
Total formal votes9,37497.10.0
Informal votes2812.90.0
Turnout 9,65596.9+2.2
Country hold Swing -1.9
1950 Queensland state election: Callide
PartyCandidateVotes%±%
Country Vincent Jones 6,03865.8
Labor Patrick Moore3,13834.2
Total formal votes9,17697.1
Informal votes2702.9
Turnout 9,44694.7
Country hold Swing

Related Research Articles

<span class="mw-page-title-main">Electoral district of Callide</span> State electoral district of Queensland, Australia

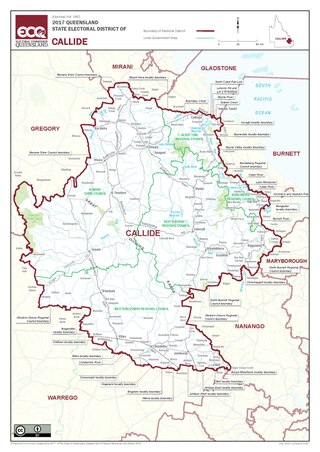
Callide is an electoral division in Queensland, Australia.

This is a list of electoral results for the electoral district of Bundaberg in Queensland state elections.

This is a list of electoral results for the electoral district of Barron River in Queensland state elections.

This is a list of electoral results for the electoral district of Bundamba in Queensland state elections.

This is a list of electoral results for the electoral district of Capalaba in Queensland state elections.

This is a list of electoral results for the electoral district of Chatsworth in Queensland state elections.

This is a list of electoral results for the electoral district of Condamine in Queensland state elections.

This is a list of electoral results for the electoral district of Currumbin in Queensland state elections.

This is a list of electoral results for the electoral district of Gaven in Queensland state elections.

This is a list of electoral results for the electoral district of Gladstone in the state elections of Queensland, Australia.

This is a list of electoral results for the electoral district of Mulgrave in Queensland state elections.

This is a list of electoral results for the electoral district of Murrumba in Queensland state elections.

This is a list of electoral results for the electoral district of Noosa in Queensland state elections.

This is a list of electoral results for the electoral district of Pine Rivers in Queensland state elections.

This is a list of electoral results for the electoral district of Redcliffe in Queensland state elections.

This is a list of electoral results for the electoral district of Redlands in Queensland state elections.

This is a list of electoral results for the electoral district of South Brisbane in Queensland state elections.

This is a list of electoral results for the electoral district of Surfers Paradise in Queensland state elections.

This is a list of election results for the 2020 Queensland state election.

<span class="mw-page-title-main">2022 Callide state by-election</span>

A by-election was held on 18 June 2022 for the Queensland Legislative Assembly seat of Callide following the resignation of Colin Boyce to contest the 2022 federal election.

References

  1. 2022 Callide State By-election, ECQ.
  2. 2020 State General Election – Callide – District Summary, ECQ.
  3. 2017 State General Election - Callide - District Summary, ECQ.
  4. 2015 State General Election - Callide - District Summary, ECQ.
  5. "Elections - 2012 State General Election - Callide - Booth Details". Archived from the original on 29 July 2012. Retrieved 21 April 2012.
  6. Green, Antony. "2009 Queensland Election: Analysis of Results" (PDF). ABC Election Unit. Retrieved 14 December 2011.