This is a list of electoral results for the electoral district of Bundaberg in Queensland state elections.
Member | Party | Term | |
---|---|---|---|
Walter Adams | Conservative | 1888–1890 | |
Ministerial | 1890–1892 | ||
George Hall | Labour | 1892–1893 | |
Michael Duffy | Ministerial | 1893–1896 | |
Thomas Glassey | Labour | 1896–1901 | |
George Barber | Labor | 1901–1935 | |
Bernard McLean | Labor | 1935–1941 | |
Frank Barnes | Independent Labor | 1941–1947 [1] | |
Frank Barnes Labor | 1947–1950 [1] | ||
Ted Walsh | Labor | 1950–1957 | |
Queensland Labor | 1957–1963 | ||
Independent | 1963–1969 | ||
Lou Jensen | Labor | 1969–1976 | |
Independent | 1976–1977 | ||
Jim Blake | Labor | 1977–1983 | |
Clem Campbell | Labor | 1983–1998 | |
Nita Cunningham | Labor | 1998–2006 | |
Jack Dempsey | National | 2006–2008 | |
Liberal National | 2008–2015 | ||
Leanne Donaldson | Labor | 2015–2017 | |
David Batt | Liberal National | 2017–2020 | |
Tom Smith | Labor | 2020–present |
Party | Candidate | Votes | % | ±% | |
---|---|---|---|---|---|
Labor | Tom Smith | 13,053 | 43.12 | +8.76 | |
Liberal National | David Batt | 12,577 | 41.55 | +6.03 | |
One Nation | Stewart Jones | 1,766 | 5.83 | −16.60 | |
Legalise Cannabis | Ian Zunker | 1,669 | 5.51 | +5.51 | |
Greens | Claire Ogden | 964 | 3.18 | −0.34 | |
United Australia | Shane Smeltz | 244 | 0.81 | +0.81 | |
Total formal votes | 30,273 | 96.48 | +1.20 | ||
Informal votes | 1,105 | 3.52 | −1.20 | ||
Turnout | 31,378 | 88.90 | −1.04 | ||
Two-party-preferred result | |||||
Labor | Tom Smith | 15,141 | 50.01 | +4.21 | |
Liberal National | David Batt | 15,132 | 49.99 | −4.21 | |
Labor gain from Liberal National | Swing | +4.21 |
Party | Candidate | Votes | % | ±% | |
---|---|---|---|---|---|
Liberal National | David Batt | 10,578 | 35.5 | −6.9 | |
Labor | Leanne Donaldson | 10,232 | 34.4 | −4.2 | |
One Nation | Jane Truscott | 6,681 | 22.4 | +22.4 | |
Greens | Marianne Buchanan | 1,050 | 3.5 | −0.6 | |
Independent | Alan Corbett | 681 | 2.3 | +2.3 | |
Independent | Richard Glass | 313 | 1.1 | +1.1 | |
Independent | Richard Smith | 248 | 0.8 | +0.8 | |
Total formal votes | 29,783 | 95.3 | −2.5 | ||
Informal votes | 1,476 | 4.7 | +2.5 | ||
Turnout | 31,259 | 89.9 | −0.7 | ||
Two-party-preferred result | |||||
Liberal National | David Batt | 16,142 | 54.2 | +4.7 | |
Labor | Leanne Donaldson | 13,641 | 45.8 | −4.7 | |
Liberal National gain from Labor | Swing | +4.7 | |||
Party | Candidate | Votes | % | ±% | |
---|---|---|---|---|---|
Liberal National | Jack Dempsey | 11,128 | 41.45 | −11.71 | |
Labor | Leanne Donaldson | 10,654 | 39.68 | +15.96 | |
Palmer United | Robert Brown | 3,208 | 11.95 | +11.95 | |
Greens | Meg Anderson | 1,112 | 4.14 | +1.20 | |
Independent | Richard Freudenberg | 746 | 2.78 | +2.78 | |
Total formal votes | 26,848 | 97.81 | +0.21 | ||
Informal votes | 602 | 2.19 | −0.21 | ||
Turnout | 27,450 | 91.67 | +0.29 | ||
Two-party-preferred result | |||||
Labor | Leanne Donaldson | 12,783 | 51.62 | +19.79 | |
Liberal National | Jack Dempsey | 11,980 | 48.38 | −19.79 | |
Labor gain from Liberal National | Swing | +19.79 | |||
Party | Candidate | Votes | % | ±% | |
---|---|---|---|---|---|
Liberal National | Jack Dempsey | 14,193 | 53.16 | −0.55 | |
Labor | Cindy Hyland | 6,335 | 23.73 | −17.85 | |
Katter's Australian | Doug Anderson | 4,117 | 15.42 | +15.42 | |
Family First | Trevor Versace | 841 | 3.15 | +3.15 | |
Greens | Peter Higgins | 785 | 2.94 | −1.77 | |
Independent | Peter Wyatt | 428 | 1.60 | +1.60 | |
Total formal votes | 26,699 | 97.59 | −0.51 | ||
Informal votes | 658 | 2.41 | +0.51 | ||
Turnout | 27,357 | 91.38 | −0.42 | ||
Two-party-preferred result | |||||
Liberal National | Jack Dempsey | 15,900 | 68.17 | +12.15 | |
Labor | Cindy Hyland | 7,423 | 31.83 | −12.15 | |
Liberal National hold | Swing | +12.15 | |||
Party | Candidate | Votes | % | ±% | |
---|---|---|---|---|---|
Liberal National | Jack Dempsey | 14,594 | 53.7 | +9.0 | |
Labor | Phil Freeman | 11,297 | 41.6 | −3.1 | |
Greens | Erin Hall | 1,281 | 4.7 | +0.8 | |
Total formal votes | 27,172 | 98.0 | |||
Informal votes | 527 | 2.0 | |||
Turnout | 27,699 | 91.80 | |||
Two-party-preferred result | |||||
Liberal National | Jack Dempsey | 14,851 | 56.0 | +5.0 | |
Labor | Phil Freeman | 11,660 | 44.0 | −5.0 | |
Liberal National hold | Swing | +5.0 | |||
Party | Candidate | Votes | % | ±% | |
---|---|---|---|---|---|
Labor | Sonja Cleary | 11,437 | 44.7 | −6.5 | |
National | Jack Dempsey | 11,400 | 44.6 | +3.9 | |
Independent | Gregory McMahon | 1,731 | 6.8 | +6.8 | |
Greens | Willy Bach | 1,002 | 3.9 | −0.7 | |
Total formal votes | 25,570 | 97.8 | −0.1 | ||
Informal votes | 568 | 2.2 | +0.1 | ||
Turnout | 26,138 | 92.4 | −0.4 | ||
Two-party-preferred result | |||||
National | Jack Dempsey | 12,439 | 51.0 | +6.3 | |
Labor | Sonja Cleary | 11,973 | 49.0 | −6.3 | |
National gain from Labor | Swing | +6.3 | |||
Party | Candidate | Votes | % | ±% | |
---|---|---|---|---|---|
Labor | Nita Cunningham | 13,104 | 51.2 | −13.7 | |
National | Jack Dempsey | 10,410 | 40.7 | +5.6 | |
Greens | Peter Ryan | 1,171 | 4.6 | +4.6 | |
Independent | Adrian Wone | 905 | 3.5 | +3.5 | |
Total formal votes | 25,590 | 97.9 | +2.1 | ||
Informal votes | 544 | 2.1 | −2.1 | ||
Turnout | 26,134 | 92.8 | −0.9 | ||
Two-party-preferred result | |||||
Labor | Nita Cunningham | 13,551 | 55.3 | −9.6 | |
National | Jack Dempsey | 10,960 | 44.7 | +9.6 | |
Labor hold | Swing | -9.6 | |||
Party | Candidate | Votes | % | ±% | |
---|---|---|---|---|---|
Labor | Nita Cunningham | 15,812 | 64.9 | +23.0 | |
National | David Porter | 8,552 | 35.1 | +9.8 | |
Total formal votes | 24,364 | 95.8 | |||
Informal votes | 1,079 | 4.2 | |||
Turnout | 25,443 | 93.7 | |||
Labor hold | Swing | +10.4 | |||
Party | Candidate | Votes | % | ±% | |
---|---|---|---|---|---|
Labor | Nita Cunningham | 8,801 | 44.4 | −6.1 | |
One Nation | Bernard Barry | 5,819 | 29.3 | +29.3 | |
National | David Porter | 4,709 | 23.7 | −25.7 | |
Greens | Ray Pearce | 303 | 1.5 | +1.5 | |
Democrats | Lance Hall | 198 | 1.0 | +1.0 | |
Total formal votes | 19,830 | 98.9 | +0.4 | ||
Informal votes | 213 | 1.1 | −0.4 | ||
Turnout | 20,043 | 93.5 | +0.9 | ||
Two-candidate-preferred result | |||||
Labor | Nita Cunningham | 9,743 | 52.0 | +1.5 | |
One Nation | Bernard Barry | 8,979 | 48.0 | +48.0 | |
Labor hold | Swing | +1.5 | |||
Party | Candidate | Votes | % | ±% | |
---|---|---|---|---|---|
Labor | Clem Campbell | 10,229 | 50.5 | −0.7 | |
National | Kay McDuff | 10,024 | 49.5 | +19.9 | |
Total formal votes | 20,253 | 98.5 | +0.5 | ||
Informal votes | 308 | 1.5 | −0.5 | ||
Turnout | 20,561 | 92.6 | |||
Labor hold | Swing | -8.1 | |||
Party | Candidate | Votes | % | ±% | |
---|---|---|---|---|---|
Labor | Clem Campbell | 10,597 | 51.2 | −5.4 | |
National | Paul Petrie | 6,119 | 29.6 | +0.2 | |
Independent | Tony Barr | 1,629 | 7.9 | +7.9 | |
Liberal | Cameron Dale | 1,290 | 6.2 | −4.0 | |
Independent | Trevor Versace | 1,065 | 5.1 | +5.1 | |
Total formal votes | 20,700 | 98.0 | |||
Informal votes | 430 | 2.0 | |||
Turnout | 21,130 | 93.2 | |||
Two-party-preferred result | |||||
Labor | Clem Campbell | 11,223 | 58.7 | −0.6 | |
National | Paul Petrie | 7,912 | 41.3 | +0.6 | |
Labor hold | Swing | -0.6 | |||
Party | Candidate | Votes | % | ±% | |
---|---|---|---|---|---|
Labor | Clem Campbell | 10,171 | 57.9 | +4.0 | |
National | Mary Ann Walsh | 5,316 | 30.3 | −10.4 | |
Liberal | Peter MacSween | 1,773 | 10.1 | +10.1 | |
Grey Power | Linues Myles | 300 | 1.7 | +1.7 | |
Total formal votes | 17,560 | 97.9 | −0.4 | ||
Informal votes | 371 | 2.1 | +0.4 | ||
Turnout | 17,931 | 92.2 | −0.8 | ||
Two-party-preferred result | |||||
Labor | Clem Campbell | 10,606 | 60.4 | +3.8 | |
National | Mary Ann Walsh | 6,954 | 39.6 | −3.8 | |
Labor hold | Swing | +3.8 | |||
Party | Candidate | Votes | % | ±% | |
---|---|---|---|---|---|
Labor | Clem Campbell | 9,223 | 53.9 | +1.9 | |
National | Heather Galley | 6,977 | 40.7 | −0.8 | |
Independent | Alex Warren | 928 | 5.4 | −1.1 | |
Total formal votes | 17,128 | 98.3 | |||
Informal votes | 290 | 1.7 | |||
Turnout | 17,418 | 93.0 | |||
Two-party-preferred result | |||||
Labor | Clem Campbell | 9,694 | 56.6 | +2.3 | |
National | Heather Galley | 7,434 | 43.4 | −2.3 | |
Labor hold | Swing | +2.3 | |||
Party | Candidate | Votes | % | ±% | |
---|---|---|---|---|---|
Labor | Clem Campbell | 7,676 | 52.0 | −2.3 | |
National | Des Barritt | 6,122 | 41.5 | +6.3 | |
Democrats | Alex Warren | 956 | 6.5 | +1.5 | |
Total formal votes | 14,754 | 99.1 | −0.1 | ||
Informal votes | 138 | 0.9 | +0.1 | ||
Turnout | 14,892 | 93.7 | +2.2 | ||
Two-party-preferred result | |||||
Labor | Clem Campbell | 8,154 | 55.3 | −3.0 | |
National | Des Barritt | 6,600 | 44.7 | +3.0 | |
Labor hold | Swing | -3.0 | |||
Party | Candidate | Votes | % | ±% | |
---|---|---|---|---|---|
Labor | Jim Blake | 7,694 | 54.3 | +5.6 | |
National | Bryan Conquest | 4,991 | 35.2 | +3.6 | |
Liberal | Graham Quirk | 787 | 5.5 | −7.6 | |
Democrats | Lola Lomax | 706 | 5.0 | +5.0 | |
Total formal votes | 14,178 | 99.2 | +0.2 | ||
Informal votes | 120 | 0.8 | −0.2 | ||
Turnout | 14,298 | 91.5 | −2.0 | ||
Two-party-preferred result | |||||
Labor | Jim Blake | 8,270 | 58.3 | +3.9 | |
National | Bryan Conquest | 5,908 | 41.7 | −3.9 | |
Labor hold | Swing | +3.9 | |||
Party | Candidate | Votes | % | ±% | |
---|---|---|---|---|---|
Labor | Jim Blake | 6,898 | 48.7 | −0.8 | |
National | Bryan Conquest | 4,471 | 31.6 | +0.5 | |
Liberal | John Heaps | 1,863 | 13.2 | −3.4 | |
Independent | Lou Jensen | 930 | 6.6 | +6.6 | |
Total formal votes | 14,162 | 99.0 | |||
Informal votes | 148 | 1.0 | |||
Turnout | 14,310 | 93.5 | |||
Two-party-preferred result | |||||
Labor | Jim Blake | 7,705 | 54.4 | +3.1 | |
National | Bryan Conquest | 6,457 | 44.6 | −3.1 | |
Labor hold | Swing | +3.1 | |||
Party | Candidate | Votes | % | ±% | |
---|---|---|---|---|---|
Labor | Lou Jensen | 5,363 | 49.5 | −19.4 | |
National | David Jenkin | 3,369 | 31.1 | +31.1 | |
Liberal | Keith Powell | 1,796 | 16.6 | +16.6 | |
Queensland Labor | Alan Birchley | 310 | 2.9 | −28.2 | |
Total formal votes | 10,838 | 98.8 | +0.6 | ||
Informal votes | 127 | 1.2 | −0.6 | ||
Turnout | 10,965 | 93.3 | +0.4 | ||
Two-party-preferred result | |||||
Labor | Lou Jensen | 5,694 | 52.5 | −2.3 | |
National | David Jenken | 5,144 | 47.5 | +2.3 | |
Labor hold | Swing | -2.3 | |||
Party | Candidate | Votes | % | ±% | |
---|---|---|---|---|---|
Labor | Lou Jensen | 6,940 | 68.9 | +19.4 | |
Queensland Labor | Alan Birchley | 3,128 | 31.1 | +28.4 | |
Total formal votes | 10,068 | 98.2 | |||
Informal votes | 185 | 1.8 | |||
Turnout | 10,253 | 92.9 | |||
Labor hold | Swing | +10.6 | |||
Party | Candidate | Votes | % | ±% | |
---|---|---|---|---|---|
Labor | Lou Jensen | 7,155 | 49.5 | +3.0 | |
Country | Paul Neville | 4,522 | 31.1 | +31.1 | |
Independent | Clifford Nielsen | 1,525 | 10.5 | +10.5 | |
Liberal | Stanley Smith | 623 | 4.3 | +4.3 | |
Queensland Labor | William Hutchinson | 389 | 2.7 | +2.7 | |
Independent | Seth Cottell | 324 | 2.2 | +2.2 | |
Total formal votes | 14,538 | 97.3 | −1.8 | ||
Informal votes | 404 | 2.7 | +1.8 | ||
Turnout | 14,942 | 94.2 | +0.4 | ||
Two-party-preferred result | |||||
Labor | Lou Jensen | 8,450 | 58.1 | +11.6 | |
Country | Paul Neville | 6,088 | 41.9 | +41.9 | |
Labor gain from Independent | Swing | +11.6 | |||
Party | Candidate | Votes | % | ±% | |
---|---|---|---|---|---|
Independent | Ted Walsh | 7,492 | 53.5 | 0.0 | |
Labor | Matt Tallon | 6,516 | 46.5 | 0.0 | |
Total formal votes | 14,008 | 99.1 | +0.2 | ||
Informal votes | 133 | 0.9 | −0.2 | ||
Turnout | 14,141 | 93.8 | −1.1 | ||
Independent hold | Swing | 0.0 | |||
Party | Candidate | Votes | % | ±% | |
---|---|---|---|---|---|
Independent | Ted Walsh | 7,011 | 53.5 | +53.5 | |
Labor | Matthew Tallon | 6,103 | 46.5 | +6.1 | |
Total formal votes | 13,114 | 98.9 | +0.8 | ||
Informal votes | 146 | 1.1 | −0.8 | ||
Turnout | 13,260 | 94.9 | 0.0 | ||
Independent gain from Queensland Labor | Swing | N/A | |||
Party | Candidate | Votes | % | ±% | |
---|---|---|---|---|---|
Queensland Labor | Ted Walsh | 5,138 | 40.5 | ||
Labor | John Salter | 5,122 | 40.4 | ||
Liberal | Robert Howard | 2,415 | 19.1 | ||
Total formal votes | 12,675 | 98.1 | |||
Informal votes | 245 | 1.9 | |||
Turnout | 12,920 | 94.9 | |||
Queensland Labor hold | Swing | ||||
Party | Candidate | Votes | % | ±% | |
---|---|---|---|---|---|
Queensland Labor | Ted Walsh | 6,058 | 53.8 | +53.8 | |
Country | Thomas Pulsford | 2,652 | 23.6 | +23.6 | |
Labor | William Elson-Green | 2,543 | 22.6 | −77.4 | |
Total formal votes | 11,253 | 99.4 | |||
Informal votes | 73 | 0.6 | |||
Turnout | 11,326 | 94.3 | |||
Queensland Labor gain from Labor | Swing | N/A | |||
Party | Candidate | Votes | % | ±% | |
---|---|---|---|---|---|
Labor | Ted Walsh | unopposed | |||
Labor hold | Swing | ||||
Party | Candidate | Votes | % | ±% | |
---|---|---|---|---|---|
Labor | Ted Walsh | 6,513 | 65.6 | +21.0 | |
Liberal | Willie Howard | 2,865 | 28.9 | +3.1 | |
Independent | James Julin | 549 | 5.5 | +5.5 | |
Total formal votes | 9,927 | 99.3 | +1.7 | ||
Informal votes | 67 | 0.7 | −1.7 | ||
Turnout | 9,994 | 94.5 | −1.0 | ||
Labor hold | Swing | +6.0 | |||
Party | Candidate | Votes | % | ±% | |
---|---|---|---|---|---|
Labor | Ted Walsh | 4,152 | 44.6 | ||
Frank Barnes Labor | Frank Barnes | 2,759 | 29.6 | ||
Liberal | Frank Row | 2,401 | 25.8 | ||
Total formal votes | 9,312 | 97.6 | |||
Informal votes | 230 | 2.4 | |||
Turnout | 9,542 | 95.5 | |||
Labor gain from Frank Barnes Labor | Swing | ||||
Party | Candidate | Votes | % | ±% | |
---|---|---|---|---|---|
Frank Barnes Labor | Frank Barnes | 4,828 | 40.4 | +0.4 | |
Labor | Viv Brown | 3,940 | 33.0 | −0.4 | |
People's Party | Geoffrey Boreham | 3,185 | 26.6 | +5.4 | |
Total formal votes | 11,953 | 99.4 | +1.1 | ||
Informal votes | 73 | 0.6 | −1.1 | ||
Turnout | 12,026 | 91.8 | +3.5 | ||
Frank Barnes Labor hold | Swing | +0.6 | |||
Party | Candidate | Votes | % | ±% | |
---|---|---|---|---|---|
Frank Barnes Labor | Frank Barnes | 4,180 | 40.0 | −11.1 | |
Labor | Bernard McLean | 3,495 | 33.4 | −15.5 | |
People's Party | Tom McCracken | 2,218 | 21.2 | +21.2 | |
Independent Labor | Arthur Howe | 432 | 4.1 | +4.1 | |
Independent | Alfred Maughan | 136 | 1.3 | +1.3 | |
Total formal votes | 10,461 | 98.3 | +0.5 | ||
Informal votes | 182 | 1.7 | −0.5 | ||
Turnout | 10,643 | 88.3 | −5.1 | ||
Frank Barnes Labor hold | Swing | +3.4 | |||
Party | Candidate | Votes | % | ±% | |
---|---|---|---|---|---|
Independent Labor | Frank Barnes | 5,476 | 51.1 | +51.1 | |
Labor | Bernard McLean | 4,356 | 48.9 | +4.8 | |
Total formal votes | 10,715 | 97.8 | −1.4 | ||
Informal votes | 246 | 2.2 | +1.4 | ||
Turnout | 10,961 | 93.4 | −2.1 | ||
Independent Labor gain from Labor | Swing | N/A | |||
Party | Candidate | Votes | % | ±% | |
---|---|---|---|---|---|
Labor | Bernard McLean | 4,356 | 44.1 | −8.3 | |
Country | Laurence Scotney | 2,393 | 24.2 | +10.1 | |
Social Credit | Henry Clegton | 1,699 | 17.2 | −16.3 | |
Protestant Labor | Ernest Miles | 1,439 | 14.6 | −18.9 | |
Total formal votes | 9,887 | 99.2 | −0.1 | ||
Informal votes | 83 | 0.8 | +0.1 | ||
Turnout | 9,970 | 95.5 | −1.2 | ||
Two-party-preferred result | |||||
Labor | Bernard McLean | 4,694 | 59.1 | ||
Country | Laurence Scotney | 3,247 | 40.9 | ||
Labor hold | Swing | N/A | |||
Party | Candidate | Votes | % | ±% | |
---|---|---|---|---|---|
Labor | Bernard McLean | 4,738 | 52.4 | ||
Social Credit | Henry Clegton | 3,029 | 33.5 | ||
CPNP | Edward Redmond | 1,279 | 14.1 | ||
Total formal votes | 9,046 | 99.3 | |||
Informal votes | 62 | 0.7 | |||
Turnout | 9,108 | 96.7 | |||
Labor hold | Swing | ||||
Party | Candidate | Votes | % | ±% | |
---|---|---|---|---|---|
Labor | George Barber | unopposed | |||
Labor hold | Swing | ||||
Party | Candidate | Votes | % | ±% | |
---|---|---|---|---|---|
Labor | George Barber | 3,816 | 51.1 | −8.3 | |
CPNP | Andrew Christiansen | 3,651 | 48.9 | +8.3 | |
Total formal votes | 7,467 | 98.7 | −0.2 | ||
Informal votes | 96 | 1.3 | +0.2 | ||
Turnout | 7,563 | 93.5 | +1.5 | ||
Labor hold | Swing | -8.3 | |||
Party | Candidate | Votes | % | ±% | |
---|---|---|---|---|---|
Labor | George Barber | 4,158 | 59.4 | +0.4 | |
CPNP | William Gavegan | 2,844 | 40.6 | −0.4 | |
Total formal votes | 7,002 | 98.9 | −0.4 | ||
Informal votes | 76 | 1.1 | +0.4 | ||
Turnout | 7,078 | 92.0 | +4.8 | ||
Labor hold | Swing | +0.4 | |||
Party | Candidate | Votes | % | ±% | |
---|---|---|---|---|---|
Labor | George Barber | 3,777 | 59.0 | +1.6 | |
Country | Henry Cattermull | 2,628 | 41.0 | −1.6 | |
Total formal votes | 6,405 | 99.3 | +0.5 | ||
Informal votes | 48 | 0.7 | −0.5 | ||
Turnout | 6,453 | 87.2 | +13.4 | ||
Labor hold | Swing | +1.6 | |||
Party | Candidate | Votes | % | ±% | |
---|---|---|---|---|---|
Labor | George Barber | 2,788 | 57.4 | −9.1 | |
Country | John Forgan | 2,073 | 42.6 | +42.6 | |
Total formal votes | 4,861 | 98.8 | −0.5 | ||
Informal votes | 60 | 1.2 | +0.5 | ||
Turnout | 4,921 | 73.8 | −9.2 | ||
Labor hold | Swing | -9.1 | |||
Party | Candidate | Votes | % | ±% | |
---|---|---|---|---|---|
Labor | George Barber | 3,184 | 66.5 | −2.5 | |
National | William Foster | 1,607 | 33.5 | +2.5 | |
Total formal votes | 4,785 | 99.3 | +0.7 | ||
Informal votes | 36 | 0.7 | −0.7 | ||
Turnout | 4,821 | 83.0 | −5.8 | ||
Labor hold | Swing | -2.5 | |||
Party | Candidate | Votes | % | ±% | |
---|---|---|---|---|---|
Labor | George Barber | 2,920 | 69.0 | +13.3 | |
Liberal | Lancelot Wilkinson | 1,311 | 31.0 | −13.3 | |
Total formal votes | 4,231 | 98.6 | −0.8 | ||
Informal votes | 61 | 1.4 | +0.8 | ||
Turnout | 4,292 | 88.8 | +5.6 | ||
Labor hold | Swing | +13.3 | |||
Party | Candidate | Votes | % | ±% | |
---|---|---|---|---|---|
Labor | George Barber | 1,926 | 55.7 | ||
Liberal | James Macleod | 1,531 | 44.3 | ||
Total formal votes | 3,457 | 99.4 | |||
Informal votes | 22 | 0.6 | |||
Turnout | 3,479 | 83.2 | |||
Labor hold | Swing | ||||
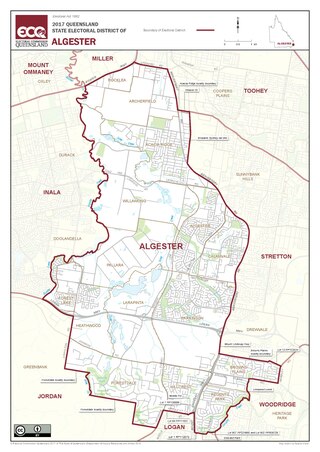
The electoral district of Algester is an electoral district of the Legislative Assembly of Queensland in south-west Brisbane. It includes the suburbs of Algester, Parkinson, Hillcrest, Boronia Heights, Forestdale, Larapinta, Heathwood, Forest Lake, Doolandella and Pallara, as well as the Greenbank Military Range. It borders the electoral districts of Sunnybank, Stretton, Logan, Lockyer, Bundamba and Inala.
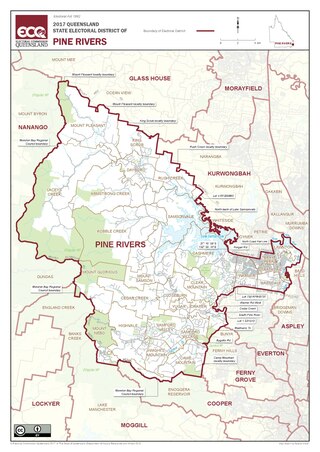
Pine Rivers is an electoral district of the Legislative Assembly in the Australian state of Queensland.
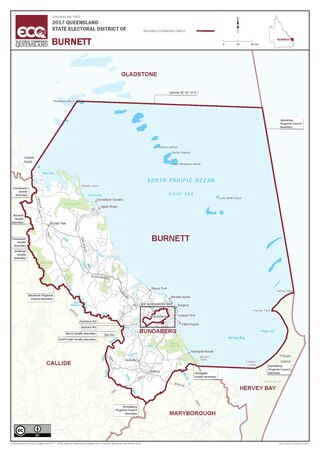
Burnett is an electoral division of the Legislative Assembly of Queensland in central Queensland, Australia.
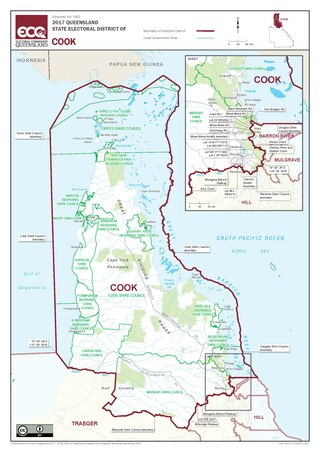
Cook is an electoral district in Queensland, Australia.
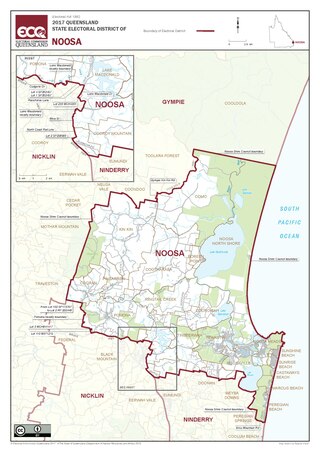
Noosa is a Legislative Assembly of Queensland electoral district in the Australian state of Queensland. The electorate is centred on Noosa and stretches northwest to the southern border of Gympie, south to Peregian Springs and west to Eumundi.
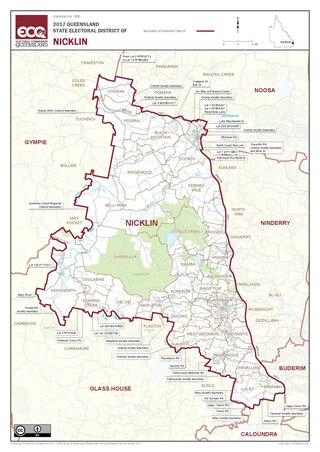
Nicklin is an electoral district of the Legislative Assembly in the Australian state of Queensland. The electorate is centred in the Sunshine Coast hinterland, and stretches north to Black Mountain, south to Palmwoods and Montville, and west to Kenilworth, including Conondale National Park. It includes notable localities such as Nambour, Yandina, Cooroy, Bli Bli, Mapleton and Woombye.
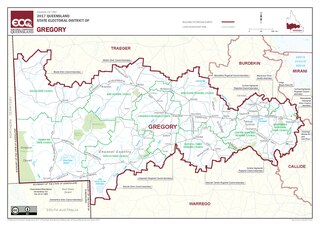
Gregory is a Legislative Assembly of Queensland electoral district in Queensland, Australia.
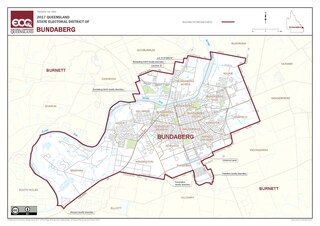
Bundaberg is an electoral district of the Legislative Assembly of Queensland in central Queensland, Australia. It covers the city of Bundaberg, as well as the immediate surrounding area.
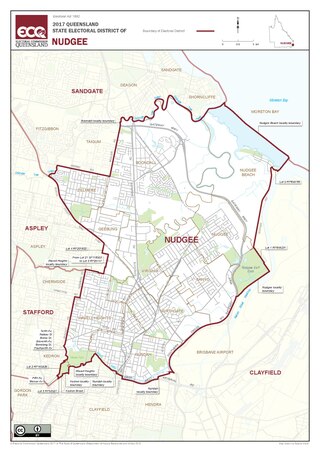
Nudgee is an electoral district of the Legislative Assembly in the Australian state of Queensland. It is located in the north-eastern suburbs of Brisbane.
Ferny Grove is one of the 89 electoral districts for the Legislative Assembly of Queensland in Australia. Located in northwest Brisbane, it is named for the suburb of Ferny Grove. It was first created in 1992, and was represented by Labor from its creation until the 2012 election, in which the LNP won with a 59.5 percent two-party vote.
Mulgrave is an electoral district of the Legislative Assembly in the Australian state of Queensland.
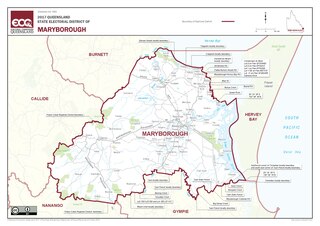
Maryborough is an electoral district of the Legislative Assembly in the Australian state of Queensland.
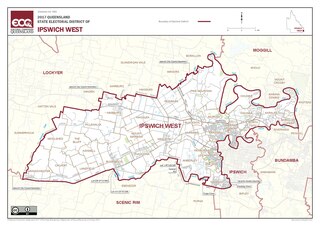
Ipswich West is an electoral district of the Legislative Assembly in the Australian state of Queensland.
Mansfield is an electoral district of the Legislative Assembly in the Australian state of Queensland.
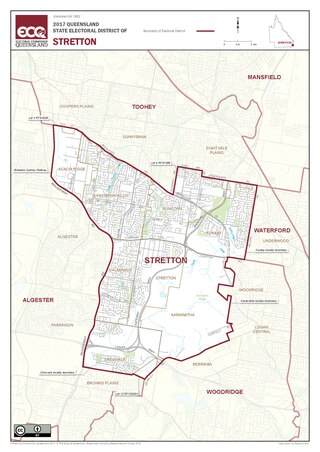
Stretton is an electoral district of the Legislative Assembly in the Australian state of Queensland.
Kurwongbah is an electoral district of the Legislative Assembly in the Australian state of Queensland which existed at first from 1992 to 2009, and was re-introduced for the 2017 state election. It is named after Lake Kurwongbah.The district is based in the City of Moreton Bay.
This is a list of electoral results for the electoral district of Logan in Queensland state elections.
This is a list of electoral results for the electoral district of Redlands in Queensland state elections.
This is a list of electoral results for the electoral district of Southport in Queensland state elections.
This is a list of electoral results for the electoral district of Stafford in Queensland state elections.
{{cite web}}
: CS1 maint: unfit URL (link)