Electoral results for the district of Townsville

Last updated

This is a list of electoral results for the electoral district of Townsville in Queensland state elections.

Contents

Members for Townsville

First incarnation (1878–1885, 1 member)
MemberPartyTerm
  John Deane Unaligned1878–1879
  John Murtagh Macrossan Unaligned1879–1885
Second incarnation (1885–1912, 2 members)
MemberPartyTerm
  John Murtagh Macrossan Unaligned1885–1891
  William Villiers Brown Unaligned1885–1888
  Robert Philp Opposition/Ministerialist1888–1912
  William Villiers Brown Unaligned1891–1893
  George Burns Ministerialist1893
  Anthony Ogden Labor 1894–1896
  William Castling Ministerialist1896–1899
  Patrick Hanran Ministerialist1899–1909
  Thomas Foley Labor 1909–1912
Third incarnation (1912–1960, 1 member)
MemberPartyTerm
  Robert Philp Opposition/Ministerialist1912–1915
  Daniel Ryan Labor 1915–1920
  William Green Northern Country 1920–1923
  Maurice Hynes Labor 1923–1939
  George Keyatta Labor 1939–1960
Fourth incarnation (1972–present, 1 member)
MemberPartyTerm
  Norman Scott-Young Liberal 1972–1983
  Ken McElligott Labor 1983–1986
  Tony Burreket National 1986–1989
  Ken Davies Labor 1989–1992
  Geoff Smith Labor 1992–1998
  Mike Reynolds Labor 1998–2009
  Mandy Johnstone Labor 2009–2012
  John Hathaway Liberal National 2012–2015
  Scott Stewart Labor 2015–present

Election results

Elections in the 2020s

2020 Queensland state election: Townsville [1]
PartyCandidateVotes%±%
Labor Scott Stewart 10,28936.20+2.62
Liberal National John Hathaway 9,50833.45+2.53
Katter's Australian Joshua Schwarz3,20411.27+11.27
Greens Tom O'Grady2,3668.32−2.53
One Nation Clive Clarkson1,2934.55−15.37
Animal Justice Samara Grumberg5541.95+1.95
Informed Medical Options Toni McMahon5341.88+1.88
United Australia Greg Dowling 5201.83+1.83
NQ First Clynton Hawks1570.55+0.55
Total formal votes28,42595.04−1.03
Informal votes1,4844.96+1.03
Turnout 29,90984.64+0.70
Two-party-preferred result
Labor Scott Stewart 15,09953.12+2.74
Liberal National John Hathaway 13,32646.88−2.74
Labor hold Swing +2.74

Elections in the 2010s

2017 Queensland state election: Townsville [2]
PartyCandidateVotes%±%
Labor Scott Stewart 9,45733.6−6.5
Liberal National Casie Scott8,70930.9−5.1
One Nation Allan Evans5,61119.9+16.1
Greens Rebecca Ryan3,05710.9+2.5
Independent Lindy Collins1,3304.7+4.7
Total formal votes28,16496.1−1.8
Informal votes1,1533.9+1.8
Turnout 29,31783.9−1.8
Two-party-preferred result
Labor Scott Stewart 14,18950.4−5.3
Liberal National Casie Scott13,97549.6+5.3
Labor hold Swing −5.3
2015 Queensland state election: Townsville [3]
PartyCandidateVotes%±%
Labor Scott Stewart 11,26740.06+10.79
Liberal National John Hathaway 10,13036.02−2.62
Palmer United Alan Birrell2,6979.59+9.59
Greens Gail Hamilton2,3568.38+0.70
One Nation Leanne Rissman1,0793.84+3.84
Family First Michael Punshon5962.12−0.48
Total formal votes28,12597.87+0.11
Informal votes6132.13−0.11
Turnout 28,73887.12−0.38
Two-party-preferred result
Labor Scott Stewart 14,28055.69+10.52
Liberal National John Hathaway 11,36044.31−10.52
Labor gain from Liberal National Swing +10.52
2012 Queensland state election: Townsville [4]
PartyCandidateVotes%±%
Liberal National John Hathaway 10,01138.63-0.69
Labor Mandy Johnstone 7,58529.27-15.10
Katter's Australian Ray Grigg5,65421.82+21.82
Greens Jenny Stirling1,9887.67-2.84
Family First Michael Punshon6742.60+0.22
Total formal votes25,91297.76+0.20
Informal votes5952.24-0.20
Turnout 26,50787.50+0.71
Two-party-preferred result
Liberal National John Hathaway 11,93754.83+9.66
Labor Mandy Johnstone 9,83545.17-9.66
Liberal National gain from Labor Swing +9.66

Elections in the 2000s

2009 Queensland state election: Townsville [5]
PartyCandidateVotes%±%
Labor Mandy Johnstone 11,10944.4-7.7
Liberal National Murray Hurst 9,84439.3+4.0
Greens Jenny Stirling2,63010.5+3.4
Independent Delena Oui-Foster8553.4+3.4
Family First Michael Punshon5972.4+2.4
Total formal votes25,03597.4
Informal votes6252.6
Turnout 25,66086.8
Two-party-preferred result
Labor Mandy Johnstone 12,40554.0-5.4
Liberal National Murray Hurst 10,56046.0+5.4
Labor hold Swing -5.4
2006 Queensland state election: Townsville
PartyCandidateVotes%±%
Labor Mike Reynolds 11,43851.8+9.4
Liberal Jessica Weber7,85835.6+3.3
Greens John Boucher1,5116.8-6.2
Independent Steve Todeschini1,2885.8+5.8
Total formal votes22,09597.7-0.0
Informal votes5262.3+0.0
Turnout 22,62186.5-1.8
Two-party-preferred result
Labor Mike Reynolds 12,25559.1+3.8
Liberal Jessica Weber8,48040.9-3.8
Labor hold Swing +3.8
2004 Queensland state election: Townsville
PartyCandidateVotes%±%
Labor Mike Reynolds 9,47842.4-9.6
Liberal Margaret Shaw7,22432.3-3.2
Greens Theresa Millard2,90813.0+13.0
One Nation Ted Ive1,8788.4+8.4
Independent Delena Foster5932.7+2.7
Independent Billy Tait2511.1-3.2
Total formal votes22,33297.7+0.9
Informal votes5142.3-0.9
Turnout 22,84688.3-1.2
Two-party-preferred result
Labor Mike Reynolds 10,81355.3-4.0
Liberal Margaret Shaw8,73044.7+4.0
Labor hold Swing -4.0
2001 Queensland state election: Townsville
PartyCandidateVotes%±%
Labor Mike Reynolds 11,49452.0+6.7
Liberal Fay Barker7,84835.5+7.8
Independent Wendy Tubman1,8338.3+8.3
Independent Billy Tait9424.3+2.5
Total formal votes22,11796.8
Informal votes7253.2
Turnout 22,84289.5
Two-party-preferred result
Labor Mike Reynolds 12,31959.3+1.8
Liberal Fay Barker8,44340.7-1.8
Labor hold Swing +1.8

Elections in the 1990s

1998 Queensland state election: Townsville
PartyCandidateVotes%±%
Labor Mike Reynolds 8,94844.6+0.7
Liberal Joy Rutledge5,41127.0-15.2
One Nation Ted Ive4,94824.7+24.7
Independent Billy Tait4302.1+2.1
Reform Steve McGuire3081.5+1.5
Total formal votes20,04597.7-0.4
Informal votes4712.3+0.4
Turnout 20,51690.2+3.8
Two-party-preferred result
Labor Mike Reynolds 10,36057.7+6.0
Liberal Joy Rutledge7,58142.3-6.0
Labor hold Swing +6.0
1995 Queensland state election: Townsville
PartyCandidateVotes%±%
Labor Geoff Smith 8,67444.0-7.5
Liberal Chris Mills8,32642.2+22.2
Greens Antony Clunies-Ross2,72213.8+13.8
Total formal votes19,72298.1+0.9
Informal votes3781.9-0.9
Turnout 20,10086.4
Two-party-preferred result
Labor Geoff Smith 9,83851.8-9.4
Liberal Chris Mills9,16048.2+9.4
Labor hold Swing -9.4
1992 Queensland state election: Townsville
PartyCandidateVotes%±%
Labor Geoff Smith 10,83951.4-6.2
Liberal Damien Massingham4,21520.0+4.5
National Jack Muller3,27115.5-9.5
Independent Colin Edwards2,74413.0+13.0
Total formal votes21,06997.3
Informal votes5932.7
Turnout 21,66287.8
Two-party-preferred result
Labor Geoff Smith 12,01961.2-0.1
Liberal Damien Massingham7,63138.8+38.8
Labor hold Swing -0.1

Elections in the 1980s

1989 Queensland state election: Townsville
PartyCandidateVotes%±%
Labor Ken Davies 9,83950.2+11.9
National Tony Burreket 5,17126.4-8.1
Liberal James Cathcart3,83919.6-4.1
Greens Sharon Crowe7483.8+3.8
Total formal votes19,59796.7-1.1
Informal votes6633.3+1.1
Turnout 20,26088.1-1.6
Two-party-preferred result
Labor Ken Davies 10,79855.1+9.5
National Tony Burreket 8,79944.9-9.5
Labor gain from National Swing +9.5
1986 Queensland state election: Townsville
PartyCandidateVotes%±%
Labor Tony Mooney 6,69338.3-9.1
National Tony Burreket 6,01434.5+5.8
Liberal Bill Mason4,14023.7+6.0
Democrats Shireen Malamoo6103.5+3.5
Total formal votes17,45797.8-1.3
Informal votes3842.2+1.3
Turnout 17,84186.5-3.1
Two-party-preferred result
National Tony Burreket 9,50254.4+3.9
Labor Tony Mooney 7,95545.6-3.9
National gain from Labor Swing +3.9
1983 Queensland state election: Townsville
PartyCandidateVotes%±%
Labor Ken McElligott 10,74847.5+5.2
National Peter Arnold6,50828.7+10.2
Liberal Norman Scott-Young 4,01217.7-21.4
Independent Daniel Gleeson1,3856.1+6.1
Total formal votes22,65399.1+0.6
Informal votes2140.9-0.6
Turnout 22,86789.6+5.3
Two-party-preferred result
Labor Ken McElligott 11,66451.5+7.5
National Peter Arnold10,98948.5+48.5
Labor gain from Liberal Swing +7.5
1980 Queensland state election: Townsville
PartyCandidateVotes%±%
Labor Brian Dobinson7,60142.3+1.7
Liberal Norman Scott-Young 7,02739.1-11.9
National Phillip Morton3,32918.5+18.5
Total formal votes17,95798.5-0.2
Informal votes2721.5+0.2
Turnout 18,22984.3-1.8
Two-party-preferred result
Liberal Norman Scott-Young 10,06156.0-0.3
Labor Brian Dobinson7,89644.0+0.3
Liberal hold Swing -0.3

Elections in the 1970s

1977 Queensland state election: Townsville
PartyCandidateVotes%±%
Liberal Norman Scott-Young 7,23551.0-11.0
Labor Helen Jeffrey5,76940.6+11.5
Independent Robert Murray8185.8+5.8
Progress Kelly Crombie3722.6+2.6
Total formal votes14,19498.7
Informal votes1871.3
Turnout 14,38186.1
Two-party-preferred result
Liberal Norman Scott-Young 7,98656.3-10.3
Labor Helen Jeffrey6,20843.7+10.3
Liberal hold Swing -10.3
1974 Queensland state election: Townsville
PartyCandidateVotes%±%
Liberal Norman Scott-Young 9,44362.0+25.5
Labor Richard Lindsay4,42729.1-14.2
Queensland Labor Brian Hurney6904.5-2.8
Australia Betty Malkin6684.4+4.4
Total formal votes15,22898.8+0.2
Informal votes1851.2-0.2
Turnout 15,41383.8-2.0
Two-party-preferred result
Liberal Norman Scott-Young 10,20767.0+5.5
Labor Richard Lindsay5,02133.0-5.5
Liberal hold Swing +5.5
1972 Queensland state election: Townsville
PartyCandidateVotes%±%
Labor Mike Reynolds 3,67243.3
Liberal Norman Scott-Young 3,91336.5
Country Owen Griffiths2,34121.9
Queensland Labor William Higgins7837.3
Total formal votes10,70998.6
Informal votes1481.4
Turnout 10,85785.8
Two-party-preferred result
Liberal Norman Scott-Young 6,58861.5+4.3
Labor Mike Reynolds 4,12138.5-4.3
Liberal hold Swing +4.3

Elections in the 1960s

See Electoral district of Townsville South 1960-1986 and Electoral district of Townsville North 1960-1972 created through redistribution.

Also see Electoral district of Townsville East 1986-1992, Electoral district of Townsville West 1972-1986, Electoral district of Mundingburra 1912-1960, 1992- and Electoral district of Burdekin 1949- created through redistributions.

Elections in the 1950s

1957 Queensland state election: Townsville
PartyCandidateVotes%±%
Labor George Keyatta 2,63140.1-6.8
Liberal Roy Pope2,29034.9-1.3
Queensland Labor Lionel Tomlins1,63725.0+25.0
Total formal votes6,55898.4-0.7
Informal votes1051.6+0.7
Turnout 6,66392.2+1.1
Labor hold Swing -2.9
1956 Queensland state election: Townsville
PartyCandidateVotes%±%
Labor George Keyatta 2,98246.9-11.5
Liberal Roy Pope2,30136.2+9.8
Independent Jack Abercrombie91514.4+2.3
Communist Hugh Fay1562.5-0.6
Total formal votes4,35499.1+0.4
Informal votes580.9-0.4
Turnout 4,41291.1-1.3
Labor hold Swing -10.6
1953 Queensland state election: Townsville
PartyCandidateVotes%±%
Labor George Keyatta 3,78658.4+6.8
Liberal Archibald Hooper1,71326.4-12.0
NQ Labor Kevin Gormley78212.1+4.9
Communist Hugh Fay2003.1+3.1
Total formal votes6,48198.7+0.1
Informal votes851.3-0.1
Turnout 6,56692.4+5.8
Labor hold Swing +11.5
1950 Queensland state election: Townsville
PartyCandidateVotes%±%
Labor George Keyatta 3,69951.6
Liberal John Taaffe2,75338.4
NQ Labor Pat Rooney5177.2
Independent Robert Baker1982.8
Total formal votes7,16798.6
Informal votes991.4
Turnout 7,26686.6
Labor hold Swing

Elections in the 1940s

1947 Queensland state election: Townsville
PartyCandidateVotes%±%
Labor George Keyatta 6,30667.8+4.9
Country Fred Feather2,99732.2+32.2
Total formal votes9,30398.6+0.1
Informal votes1281.4-0.1
Turnout 9,43184.4+2.6
Labor hold Swing N/A
1944 Queensland state election: Townsville
PartyCandidateVotes%±%
Labor George Keyatta 5,58362.9-37.1
Hermit Park Labor Ernest O'Brien1,86321.0+21.0
People's Party Athena Deane1,42516.1+16.1
Total formal votes8,87198.5
Informal votes1321.5
Turnout 9,00381.8
Labor hold Swing N/A
1941 Queensland state election: Townsville
PartyCandidateVotes%±%
Labor George Keyatta unopposed
Labor hold Swing

Elections in the 1930s

1938 Queensland state election: Townsville
PartyCandidateVotes%±%
Labor Maurice Hynes 4,37950.0-27.0
Protestant Labor Alfred Loveridge2,37827.2+27.2
Country Spenser Hopkins1,44516.5-6.5
Communist Albert Robinson5486.3+6.3
Total formal votes8,75099.2+0.9
Informal votes660.8-0.9
Turnout 8,81689.5+1.5
Labor hold Swing N/A
1935 Queensland state election: Townsville
PartyCandidateVotes%±%
Labor Maurice Hynes 6,45977.0
CPNP Percy Davids1,93523.0
Total formal votes8,39498.3
Informal votes1461.7
Turnout 8,54088.0
Labor hold Swing
1932 Queensland state election: Townsville
PartyCandidateVotes%±%
Labor Maurice Hynes 5,68673.0
Independent John Burns1,99025.5
Communist Douglas Price1141.5
Total formal votes7,79098.8
Informal votes921.2
Turnout 7,88292.0
Labor hold Swing

Elections in the 1920s

1929 Queensland state election: Townsville
PartyCandidateVotes%±%
Labor Maurice Hynes 2,43754.5-9.7
CPNP Ernest Garbutt1,89042.3+6.5
Communist Desmond Morris1162.6+2.6
Independent William Jackson250.6+0.6
Total formal votes4,46896.9-1.6
Informal votes1443.1+1.6
Turnout 4,61288.4+1.5
Labor hold Swing N/A
1926 Queensland state election: Townsville
PartyCandidateVotes%±%
Labor Maurice Hynes 2,90364.2+12.2
CPNP John Shearer1,61735.8-12.2
Total formal votes4,52098.5-0.6
Informal votes671.5+0.6
Turnout 4,58786.9+4.5
Labor hold Swing +12.2
1923 Queensland state election: Townsville
PartyCandidateVotes%±%
Labor Maurice Hynes 2,16852.0+7.0
United William Green 2,00448.0-7.0
Total formal votes4,17299.1+0.7
Informal votes380.9-0.7
Turnout 4,21082.4+2.4
Labor gain from United Swing +7.0
1920 Queensland state election: Townsville
PartyCandidateVotes%±%
Northern Country William Green 2,90155.0+55.0
Labor Daniel Ryan 2,37645.0-9.1
Total formal votes5,27798.4+0.2
Informal votes881.6-0.2
Turnout 5,36580.0+2.9
Independent Country gain from Labor Swing N/A

Elections in the 1910s

1918 Queensland state election: Townsville
PartyCandidateVotes%±%
Labor Daniel Ryan 2,87754.6+2.4
National Hedley Gelston2,38845.4-2.4
Total formal votes5,26598.2-0.4
Informal votes941.8+0.4
Turnout 5,35977.1-2.4
Labor hold Swing +2.4
1915 Queensland state election: Townsville
PartyCandidateVotes%±%
Labor Daniel Ryan 2,31852.2+6.5
Liberal Robert Philp 2,12047.8-6.5
Total formal votes4,43898.6+0.3
Informal votes621.4-0.3
Turnout 4,50079.5+6.8
Labor gain from Liberal Swing +6.5
1912 Queensland state election: Townsville
PartyCandidateVotes%±%
Liberal Robert Philp 1,90854.3
Labor Alexander Austin1,60445.7
Total formal votes3,51298.3
Informal votes601.7
Turnout 3,57272.7
Liberal hold Swing

Related Research Articles

Electoral district of Pine Rivers State electoral district of Queensland, Australia

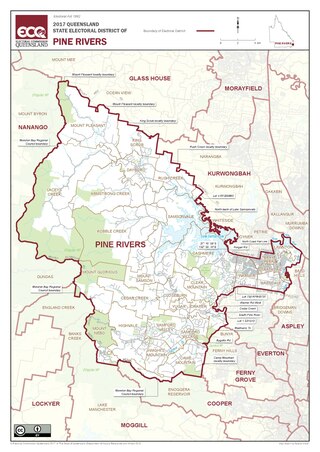
Pine Rivers is an electoral district of the Legislative Assembly in the Australian state of Queensland.

Electoral district of Townsville State electoral district of Queensland, Australia

Townsville is an electoral district of the Legislative Assembly in the Australian state of Queensland. The seat is one of four within the Townsville urban area in North Queensland, and covers the Eastern and Northern suburbs of the City of Townsville as well as Magnetic Island and Palm Island.

Electoral district of Burdekin State electoral district of Queensland, Australia

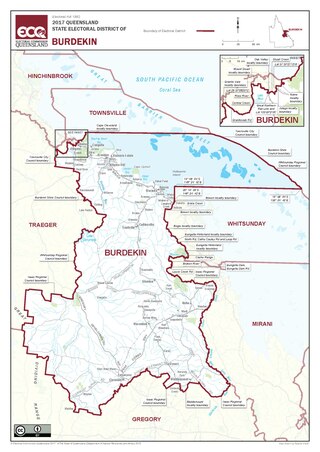
Burdekin is an electoral district in the Legislative Assembly of Queensland in the state of Queensland, Australia. Centred on the Ayr–Home Hill region, the electorate also includes some of Townsville's southern semi-rural localities as well as the coal-mining town of Collinsville. The Burdekin River flows through part of the electorate.
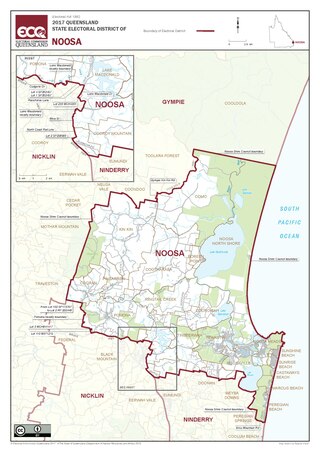
Electoral district of Hinchinbrook State electoral district of Queensland, Australia

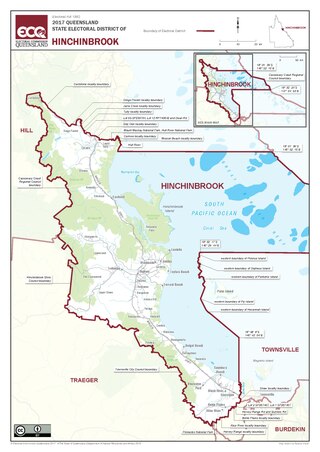
Hinchinbrook is an electoral district of the Legislative Assembly in the Australian state of Queensland.

Electoral district of Kurwongbah State electoral district of Queensland, Australia

Kurwongbah is an electoral district of the Legislative Assembly in the Australian state of Queensland which existed at first from 1992 to 2009, and was re-introduced for the 2017 state election. It is named after Lake Kurwongbah.The district is based in the Moreton Bay Region.

This is a list of electoral results for the electoral district of Bundaberg in Queensland state elections.

This is a list of electoral results for the electoral district of Bulimba in Queensland state elections.

This is a list of electoral results for the electoral district of Cairns in Queensland state elections.

This is a list of electoral results for the electoral district of Cook in Queensland state elections.

This is a list of electoral results for the electoral district of Gympie in Queensland state elections.

This is a list of electoral results for the electoral district of Keppel in Queensland state elections.

This is a list of electoral results for the electoral district of Logan in Queensland state elections.

This is a list of electoral results for the electoral district of Mackay in Queensland state elections.

This is a list of electoral results for the electoral district of Maryborough in Queensland state elections.

This is a list of electoral results for the electoral district of Mundingburra in Queensland state elections.

This is a list of electoral results for the electoral district of Murrumba in Queensland state elections.

This is a list of electoral results for the electoral district of Rockhampton in Queensland state elections.

This is a list of electoral results for the electoral district of Sandgate in Queensland state elections.

This is a list of electoral results for the electoral district of Warrego in Queensland state elections.

Electoral district of Maiwar State electoral district of Queensland, Australia

Maiwar is an electoral district of the Legislative Assembly in the Australian state of Queensland, incorporating the inner western suburbs of Brisbane. It was created in the 2017 redistribution, and was first contested at the 2017 Queensland state election. The electorate name is stated by the Government as being named based on an aboriginal name of the Brisbane River, however it is not the name that the Turrbal people who lived in the Brisbane region had for the river. The Brisbane River forms the southern boundary of the electorate.

References

  1. 2020 State General Election – Townsville – District Summary, ECQ.
  2. 2017 State General Election - Townsville - District Summary, ECQ.
  3. 2015 State General Election - Townsville - District Summary, ECQ.
  4. "Elections - 2012 State General Election - Townsville - Booth Details". Archived from the original on 29 July 2012. Retrieved 18 May 2012.
  5. Green, Antony. "2009 Queensland Election: Analysis of Results" (PDF). ABC Election Unit. Retrieved 15 December 2011.