This is a list of electoral results for the electoral district of Toowoomba North in Queensland state elections.
Member | Party | Term | |
---|---|---|---|
Ray Bousen | Labor | 1972–1974 | |
John Lockwood | Liberal | 1974–1983 | |
Sandy McPhie | National | 1983–1989 | |
John Flynn | Labor | 1989–1992 | |
Graham Healy | National | 1992–2001 | |
Kerry Shine | Labor | 2001–2012 | |
Trevor Watts | Liberal National | 2012–present |
Party | Candidate | Votes | % | ±% | |
---|---|---|---|---|---|
Liberal National | Trevor Watts | 16,115 | 49.99 | +7.80 | |
Labor | Megan O'Hara Sullivan | 11,297 | 35.04 | +2.02 | |
One Nation | Ron Humphrey | 2,380 | 7.38 | −7.28 | |
Greens | Alyce Nelligan | 2,080 | 6.45 | −0.08 | |
United Australia | Stella Sokolova | 364 | 1.13 | +1.13 | |
Total formal votes | 32,236 | 97.52 | +1.13 | ||
Informal votes | 819 | 2.48 | −1.13 | ||
Turnout | 33,055 | 88.33 | +0.14 | ||
Two-party-preferred result | |||||
Liberal National | Trevor Watts | 18,479 | 57.32 | +1.60 | |
Labor | Megan O'Hara Sullivan | 13,757 | 42.68 | −1.60 | |
Liberal National hold | Swing | +1.60 |
Party | Candidate | Votes | % | ±% | |
---|---|---|---|---|---|
Liberal National | Trevor Watts | 13,128 | 42.2 | −2.2 | |
Labor | Kerry Shine | 10,274 | 33.0 | −5.8 | |
One Nation | Paul Wilson | 4,561 | 14.7 | +14.7 | |
Greens | Emmeline Chidley | 2,033 | 6.5 | +2.0 | |
Independent | Josie Townsend | 1,118 | 3.6 | +3.6 | |
Total formal votes | 31,114 | 96.4 | −1.7 | ||
Informal votes | 1,166 | 3.6 | +1.7 | ||
Turnout | 32,280 | 88.2 | −1.9 | ||
Two-party-preferred result | |||||
Liberal National | Trevor Watts | 17,337 | 55.7 | +4.1 | |
Labor | Kerry Shine | 13,777 | 44.3 | −4.1 | |
Liberal National hold | Swing | +4.1 | |||
Party | Candidate | Votes | % | ±% | |
---|---|---|---|---|---|
Liberal National | Trevor Watts | 13,932 | 44.41 | −5.35 | |
Labor | Kerry Shine | 12,166 | 38.78 | +6.49 | |
Palmer United | Mandeep Sandhu | 1,578 | 5.03 | +5.03 | |
Greens | Ken Gover | 1,430 | 4.56 | −0.32 | |
Katter's Australian | Ken Elliott | 1,050 | 3.35 | −8.29 | |
Family First | John Sands | 871 | 2.78 | +2.78 | |
Independent | Greg Keane | 347 | 1.11 | −0.34 | |
Total formal votes | 31,374 | 98.11 | −0.05 | ||
Informal votes | 606 | 1.89 | +0.05 | ||
Turnout | 31,980 | 91.00 | −1.36 | ||
Two-party-preferred result | |||||
Liberal National | Trevor Watts | 14,999 | 51.61 | −7.97 | |
Labor | Kerry Shine | 14,064 | 48.39 | +7.97 | |
Liberal National hold | Swing | −7.97 | |||
Party | Candidate | Votes | % | ±% | |
---|---|---|---|---|---|
Liberal National | Trevor Watts | 14,898 | 49.75 | +7.62 | |
Labor | Kerry Shine | 9,667 | 32.28 | −15.42 | |
Katter's Australian | Peter Pyke | 3,485 | 11.64 | +11.64 | |
Greens | Frida Forsberg | 1,461 | 4.88 | −0.31 | |
Independent | Neil Riethmuller | 433 | 1.45 | +0.41 | |
Total formal votes | 29,944 | 98.15 | −0.02 | ||
Informal votes | 563 | 1.85 | +0.02 | ||
Turnout | 30,507 | 92.36 | +0.67 | ||
Two-party-preferred result | |||||
Liberal National | Trevor Watts | 16,126 | 59.58 | +12.80 | |
Labor | Kerry Shine | 10,942 | 40.42 | −12.80 | |
Liberal National gain from Labor | Swing | +12.80 | |||
Party | Candidate | Votes | % | ±% | |
---|---|---|---|---|---|
Labor | Kerry Shine | 13,911 | 47.7 | −2.7 | |
Liberal National | Trevor Watts | 12,289 | 42.1 | +6.0 | |
Greens | Brett Robinson | 1,515 | 5.2 | −0.4 | |
Family First | Archie Franz | 654 | 2.2 | −2.2 | |
Independent | Perry Jewell | 494 | 1.7 | +1.7 | |
Independent | Neil Riethmuller | 303 | 1.0 | +1.0 | |
Total formal votes | 29,166 | 98.1 | |||
Informal votes | 544 | 1.9 | |||
Turnout | 29,710 | 91.7 | |||
Two-party-preferred result | |||||
Labor | Kerry Shine | 14,651 | 53.2 | −4.4 | |
Liberal National | Trevor Watts | 12,876 | 46.8 | +4.4 | |
Labor hold | Swing | -4.4 | |||
Party | Candidate | Votes | % | ±% | |
---|---|---|---|---|---|
Labor | Kerry Shine | 12,374 | 53.2 | +1.0 | |
National | Lyle Shelton | 7,899 | 34.0 | −3.9 | |
Greens | Greg Keane | 1,206 | 5.2 | +0.1 | |
Family First | Archie Franz | 896 | 3.9 | +3.9 | |
Independent | George Westgarth | 890 | 3.8 | +3.8 | |
Total formal votes | 23,265 | 98.5 | +0.1 | ||
Informal votes | 358 | 1.5 | −0.1 | ||
Turnout | 23,623 | 92.2 | +0.0 | ||
Two-party-preferred result | |||||
Labor | Kerry Shine | 13,262 | 60.4 | +3.1 | |
National | Lyle Shelton | 8,690 | 39.6 | −3.1 | |
Labor hold | Swing | +3.1 | |||
Party | Candidate | Votes | % | ±% | |
---|---|---|---|---|---|
Labor | Kerry Shine | 11,785 | 52.2 | +8.1 | |
National | Ian Douglas | 8,567 | 37.9 | −1.8 | |
Greens | Michael Kane | 1,162 | 5.1 | +5.1 | |
One Nation | Sean Rycard | 1,083 | 4.8 | +4.8 | |
Total formal votes | 22,597 | 98.4 | +0.7 | ||
Informal votes | 358 | 1.6 | −0.7 | ||
Turnout | 22,955 | 92.2 | −1.0 | ||
Two-party-preferred result | |||||
Labor | Kerry Shine | 12,388 | 57.3 | +5.4 | |
National | Ian Douglas | 9,235 | 42.7 | −5.4 | |
Labor hold | Swing | +5.4 | |||
Party | Candidate | Votes | % | ±% | |
---|---|---|---|---|---|
Labor | Kerry Shine | 9,772 | 44.1 | +11.9 | |
National | Graham Healy | 8,795 | 39.7 | −0.8 | |
City Country Alliance | Frank Francis | 1,529 | 6.9 | +6.9 | |
Independent | Rob Berry | 1,215 | 5.5 | +5.5 | |
Independent | Grahame Mogg | 846 | 3.8 | +3.8 | |
Total formal votes | 22,157 | 97.7 | |||
Informal votes | 527 | 2.3 | |||
Turnout | 22,684 | 93.2 | |||
Two-party-preferred result | |||||
Labor | Kerry Shine | 10,503 | 51.9 | +11.9 | |
National | Graham Healy | 9,747 | 48.1 | −11.9 | |
Labor gain from National | Swing | +11.9 | |||
Party | Candidate | Votes | % | ±% | |
---|---|---|---|---|---|
National | Graham Healy | 7,678 | 39.8 | −16.9 | |
Labor | Kerry Shine | 6,634 | 34.4 | −4.0 | |
One Nation | Ron Davy | 4,654 | 24.1 | +24.1 | |
Reform | Barry Reid | 319 | 1.7 | +1.7 | |
Total formal votes | 19,285 | 98.9 | +0.6 | ||
Informal votes | 214 | 1.1 | −0.6 | ||
Turnout | 19,499 | 93.7 | +1.0 | ||
Two-party-preferred result | |||||
National | Graham Healy | 10,475 | 58.2 | −1.4 | |
Labor | Kerry Shine | 7,522 | 41.8 | +1.4 | |
National hold | Swing | -1.4 | |||
Party | Candidate | Votes | % | ±% | |
---|---|---|---|---|---|
National | Graham Healy | 11,012 | 56.7 | +17.3 | |
Labor | Des McGovern | 7,463 | 38.4 | −6.7 | |
Independent | Ray Webber | 936 | 4.8 | +4.8 | |
Total formal votes | 19,411 | 98.3 | +0.2 | ||
Informal votes | 340 | 1.7 | −0.2 | ||
Turnout | 19,751 | 92.7 | |||
Two-party-preferred result | |||||
National | Graham Healy | 11,459 | 59.6 | +9.1 | |
Labor | Des McGovern | 7,756 | 40.4 | −9.1 | |
National hold | Swing | -9.1 | |||
Party | Candidate | Votes | % | ±% | |
---|---|---|---|---|---|
Labor | John Flynn | 9,249 | 45.2 | +2.5 | |
National | Graham Healy | 8,077 | 39.5 | +12.5 | |
Liberal | Rosalie Lang | 1,878 | 9.2 | −14.5 | |
Confederate Action | Allen Parsons | 837 | 4.1 | +4.1 | |
Indigenous Peoples | Walter McCarthy | 428 | 2.1 | +2.1 | |
Total formal votes | 20,469 | 98.1 | |||
Informal votes | 405 | 1.9 | |||
Turnout | 20,874 | 92.8 | |||
Two-party-preferred result | |||||
National | Graham Healy | 9,986 | 50.5 | +1.4 | |
Labor | John Flynn | 9,787 | 49.5 | −1.4 | |
National gain from Labor | Swing | +1.4 | |||
Party | Candidate | Votes | % | ±% | |
---|---|---|---|---|---|
Labor | John Flynn | 8,649 | 43.6 | +6.0 | |
National | Sandy McPhie | 5,251 | 26.5 | −21.0 | |
Liberal | John Gouldson | 4,636 | 23.4 | +8.6 | |
Independent | Vincent Burke | 1,301 | 6.6 | +6.6 | |
Total formal votes | 19,837 | 97.7 | −0.5 | ||
Informal votes | 470 | 2.3 | +0.5 | ||
Turnout | 18,571 | 93.0 | +0.2 | ||
Two-party-preferred result | |||||
Labor | John Flynn | 10,101 | 50.9 | +8.5 | |
National | Sandy McPhie | 9,736 | 49.1 | −8.5 | |
Labor gain from National | Swing | +8.5 | |||
Party | Candidate | Votes | % | ±% | |
---|---|---|---|---|---|
National | Sandy McPhie | 8,665 | 47.5 | +11.0 | |
Labor | Sheila Forknall | 6,860 | 37.6 | −5.0 | |
Liberal | Janet Rankin | 2,705 | 14.8 | −6.1 | |
Total formal votes | 18,230 | 98.2 | −0.7 | ||
Informal votes | 341 | 1.8 | +0.7 | ||
Turnout | 18,571 | 93.0 | +0.2 | ||
Two-party-preferred result | |||||
National | Sandy McPhie | 10,505 | 57.6 | +3.5 | |
Labor | Sheila Forknall | 7,725 | 42.4 | −3.5 | |
National hold | Swing | +3.5 | |||
Party | Candidate | Votes | % | ±% | |
---|---|---|---|---|---|
Labor | Peter Wood | 7,006 | 42.6 | −1.9 | |
National | Sandy McPhie | 6,002 | 36.5 | +36.5 | |
Liberal | John Lockwood | 3,444 | 20.9 | −34.6 | |
Total formal votes | 16,452 | 98.9 | +0.7 | ||
Informal votes | 181 | 1.1 | −0.7 | ||
Turnout | 16,633 | 93.3 | +3.5 | ||
Two-party-preferred result | |||||
National | Sandy McPhie | 8,818 | 53.6 | +53.6 | |
Labor | Peter Wood | 7,634 | 46.4 | +1.9 | |
National gain from Liberal | Swing | N/A | |||
Party | Candidate | Votes | % | ±% | |
---|---|---|---|---|---|
Liberal | John Lockwood | 8,418 | 55.5 | +8.0 | |
Labor | Lindsay Jones | 6,754 | 44.5 | −0.9 | |
Total formal votes | 15,172 | 98.2 | −0.6 | ||
Informal votes | 280 | 1.8 | +0.6 | ||
Turnout | 15,452 | 89.8 | −2.7 | ||
Liberal hold | Swing | +3.9 | |||
Party | Candidate | Votes | % | ±% | |
---|---|---|---|---|---|
Liberal | John Lockwood | 7,092 | 47.5 | −5.8 | |
Labor | Ray Bousen | 6,778 | 45.4 | +1.3 | |
Democrats | Clifford Knight | 846 | 5.7 | +5.7 | |
Progress | Michael Farrell | 220 | 1.5 | +1.5 | |
Total formal votes | 14,936 | 98.8 | |||
Informal votes | 174 | 1.2 | |||
Turnout | 15,110 | 92.5 | |||
Two-party-preferred result | |||||
Liberal | John Lockwood | 7,714 | 51.6 | −1.7 | |
Labor | Ray Bousen | 7,222 | 48.4 | +1.7 | |
Liberal hold | Swing | -1.7 | |||
Party | Candidate | Votes | % | ±% | |
---|---|---|---|---|---|
Liberal | John Lockwood | 6,848 | 52.3 | +38.8 | |
Labor | Ray Bousen | 6,245 | 47.7 | −14.1 | |
Total formal votes | 13,093 | 99.0 | −0.2 | ||
Informal votes | 133 | 1.0 | +0.2 | ||
Turnout | 13,226 | 89.7 | −3.9 | ||
Liberal gain from Labor | Swing | +17.2 | |||
Party | Candidate | Votes | % | ±% | |
---|---|---|---|---|---|
Labor | Ray Bousen | 7,336 | 61.8 | +13.8 | |
Country | Nellie E. Robinson | 2,072 | 17.4 | −9.4 | |
Liberal | A.L.P. Zerbst | 1,599 | 13.5 | −2.9 | |
Queensland Labor | John Davis | 872 | 7.3 | −1.5 | |
Total formal votes | 11,879 | 99.2 | |||
Informal votes | 99 | 0.8 | |||
Turnout | 11,978 | 93.6 | |||
Two-party-preferred result | |||||
Labor | Ray Bousen | 7,707 | 64.9 | +7.8 | |
Country | Nellie Robinson | 4,172 | 35.1 | −7.8 | |
Labor hold | Swing | +7.8 | |||
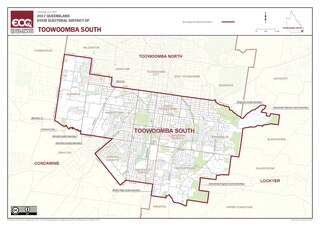
Toowoomba South is an electoral district of the Legislative Assembly in the Australian state of Queensland. It was created with the 1972 redistribution, and replaced the abolished Toowoomba East.
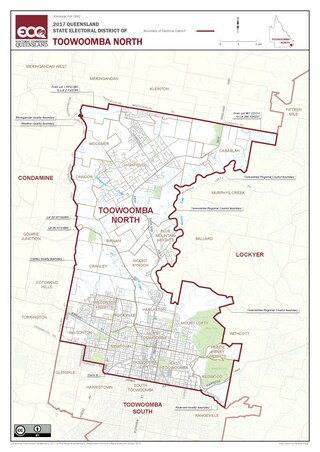
Toowoomba North is an electoral district of the Legislative Assembly in the Australian state of Queensland. It was created with the 1972 redistribution. It replaced the abolished electorate of Toowoomba West. Toowoomba North is largely based around the upper half of the city of Toowoomba.
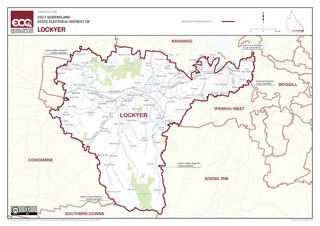
Lockyer is an electoral district of the Legislative Assembly in the Australian state of Queensland.
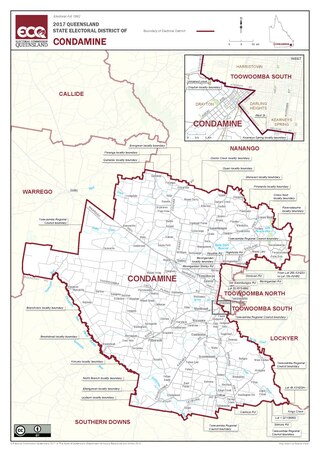
Condamine is an electoral district of the Legislative Assembly in the Australian state of Queensland.
This is a list of electoral results for the electoral district of Bundamba in Queensland state elections.
This is a list of electoral results for the electoral district of Callide in Queensland state elections.
This is a list of electoral results for the electoral district of Chatsworth in Queensland state elections.
This is a list of electoral results for the electoral district of Condamine in Queensland state elections.
This is a list of electoral results for the electoral district of Currumbin in Queensland state elections.
This is a list of electoral results for the electoral district of Gladstone in the state elections of Queensland, Australia.
This is a list of electoral results for the electoral district of Inala in Queensland state elections.
This is a list of electoral results for the electoral district of Maroochydore in Queensland state elections.
This is a list of electoral results for the electoral district of Mulgrave in Queensland state elections.
This is a list of electoral results for the electoral district of Mundingburra in Queensland state elections.
This is a list of electoral results for the electoral district of Redcliffe in Queensland state elections.
This is a list of electoral results for the electoral district of South Brisbane in Queensland state elections.
This is a list of electoral results for the electoral district of Surfers Paradise in Queensland state elections.
This is a list of electoral results for the electoral district of Toowoomba South in Queensland state elections.
This is a list of electoral results for the electoral district of Townsville in Queensland state elections.
This is a list of election results for the 2020 Queensland state election.