Electoral results for the district of Clayfield

Last updated

This is a list of electoral results for the electoral district of Clayfield in Queensland state elections.

Contents

Members for Clayfield

First incarnation (1950–1977)
MemberPartyTerm
  Harold Taylor Liberal 1950–1963
  John Murray Liberal 1963–1976
  Ivan Brown Liberal 1976–1977
Second incarnation (1992–present)
MemberPartyTerm
  Santo Santoro Liberal 1992–2001
  Liddy Clark Labor 2001–2006
  Tim Nicholls Liberal 2006–2008
  Liberal National 2008–present

Election results

Elections in the 2020s

2024 Queensland state election: Clayfield [1]
PartyCandidateVotes%±%
Liberal National Tim Nicholls 16,56448.1+2.2
Labor Belle Brookfield10,07029.3−2.8
Greens Jaimyn Mayer5,86317.0−0.6
One Nation Michelle Wilde1,0743.1+0.8
Libertarian Nick Buick8612.5+2.5
Total formal votes34,43298.1
Informal votes6511.9
Turnout 35,083
Two-party-preferred result
Liberal National Tim Nicholls 18,63854.1+2.6
Labor Belle Brookfield15,79445.9−2.6
Liberal National hold Swing +2.6
Results are not final. Last updated on 30 October 2024.
2020 Queensland state election: Clayfield [2]
PartyCandidateVotes%±%
Liberal National Tim Nicholls 15,97945.89−1.94
Labor Philip Anthony11,15732.04−0.84
Greens Andrew Bartlett 6,13217.61−1.67
One Nation Abby Douglas8172.35+2.35
  Independent Liberal Democrat Robert King4781.37+1.37
Civil Liberties & Motorists Kathy Moloney2540.73+0.73
Total formal votes34,81797.98+1.74
Informal votes7192.02−1.74
Turnout 35,53688.36+1.60
Two-party-preferred result
Liberal National Tim Nicholls 17,94951.55−0.86
Labor Philip Anthony16,86848.45+0.86
Liberal National hold Swing −0.86

Elections in the 2010s

2017 Queensland state election: Clayfield [3]
PartyCandidateVotes%±%
Liberal National Tim Nicholls 15,35947.8−4.8
Labor Philip Anthony10,55932.9+0.6
Greens Claire Ogden6,19019.3+7.3
Total formal votes32,10896.2−2.2
Informal votes1,2563.8+2.2
Turnout 33,36486.8+1.6
Two-party-preferred result
Liberal National Tim Nicholls 16,82952.4−4.2
Labor Philip Anthony15,27947.6+4.2
Liberal National hold Swing −4.2
2015 Queensland state election: Clayfield [4]
PartyCandidateVotes%±%
Liberal National Tim Nicholls 16,11352.89−9.44
Labor John Martin9,76932.07+10.47
Greens Anthony Pink3,39311.14+0.30
Independent Katrina MacDonald1,1883.90+3.90
Total formal votes30,46398.39+0.02
Informal votes4981.61−0.02
Turnout 30,96189.38−1.93
Two-party-preferred result
Liberal National Tim Nicholls 16,73557.21−13.35
Labor John Martin12,51542.79+13.35
Liberal National hold Swing −13.35
2012 Queensland state election: Clayfield [5]
PartyCandidateVotes%±%
Liberal National Tim Nicholls 17,64862.33+13.09
Labor Brent Davidson6,11521.60−14.94
Greens Luke Morey3,06810.84+0.17
Katter's Australian Will Keenan1,4835.24+5.24
Total formal votes28,31498.37−0.28
Informal votes4701.63+0.28
Turnout 28,78491.30+0.14
Two-party-preferred result
Liberal National Tim Nicholls 18,59770.56+14.72
Labor Brent Davidson7,76029.44−14.72
Liberal National hold Swing +14.72

Elections in the 2000s

2009 Queensland state election: Clayfield [6]
PartyCandidateVotes%±%
Liberal National Tim Nicholls 13,78449.2+5.1
Labor Joff Lelliott10,23036.5−4.7
Greens Andrew Jeremijenko2,98810.7−0.1
DS4SEQ Randle Thomas5602.0+2.0
Family First Brendan Wong4331.5+1.5
Total formal votes27,99598.5
Informal votes3841.5
Turnout 28,37991.2
Two-party-preferred result
Liberal National Tim Nicholls 14,73855.8+6.1
Labor Joff Lelliott11,65644.2−6.1
Liberal National hold Swing +6.1
2006 Queensland state election: Clayfield
PartyCandidateVotes%±%
Liberal Tim Nicholls 10,84746.2+1.1
Labor Liddy Clark 9,33539.7−5.5
Greens Justin Wells2,41910.3+2.7
Independent Brad Gradwell7203.1+3.1
Independent Erik Eriksen1710.7+0.7
Total formal votes23,49298.5+0.0
Informal votes3571.5−0.0
Turnout 25,81489.1−1.2
Two-party-preferred result
Liberal Tim Nicholls 11,55351.7+2.9
Labor Liddy Clark 10,80648.3−2.9
Liberal gain from Labor Swing +2.9
2004 Queensland state election: Clayfield
PartyCandidateVotes%±%
Labor Liddy Clark 10,63345.2−0.7
Liberal Sally Hannah10,59845.1+2.9
Greens Peter Thomas1,7877.6+2.4
Independent Robyn McGee4912.1+2.1
Total formal votes23,50998.5+0.1
Informal votes3581.5−0.1
Turnout 23,86790.3−1.7
Two-party-preferred result
Labor Liddy Clark 11,61151.2−0.8
Liberal Sally Hannah11,07848.8+0.8
Labor hold Swing −0.8
2001 Queensland state election: Clayfield
PartyCandidateVotes%±%
Labor Liddy Clark 10,83945.9+5.6
Liberal Santo Santoro 9,94842.2−7.3
Independent Robert Brittan1,5826.7+6.7
Greens Marit Hegge1,2285.2+1.3
Total formal votes23,59798.4
Informal votes3941.6
Turnout 23,99192.0
Two-party-preferred result
Labor Liddy Clark 11,59352.0+6.5
Liberal Santo Santoro 10,70848.0−6.5
Labor gain from Liberal Swing +6.5

Elections in the 1990s

1998 Queensland state election: Clayfield
PartyCandidateVotes%±%
Liberal Santo Santoro 10,10752.6−7.5
Labor Liddy Clark 7,49839.0+5.4
Greens Malcolm Lewis8714.5+4.5
Democrats Michael Brown7563.9−2.4
Total formal votes19,23298.3−0.3
Informal votes3311.7+0.3
Turnout 19,56392.0+0.8
Two-party-preferred result
Liberal Santo Santoro 10,48156.5−7.6
Labor Liddy Clark 8,05443.5+7.6
Liberal hold Swing −7.6
1995 Queensland state election: Clayfield
PartyCandidateVotes%±%
Liberal Santo Santoro 11,52160.0+8.9
Labor Dennis Williams6,44533.6−9.6
Democrats James Leddy1,2246.4+6.4
Total formal votes19,19098.6+0.5
Informal votes2771.4−0.5
Turnout 19,46791.2
Two-party-preferred result
Liberal Santo Santoro 12,07364.2+10.1
Labor Dennis Williams6,74235.8−10.1
Liberal hold Swing +10.1
1992 Queensland state election: Clayfield
PartyCandidateVotes%±%
Liberal Santo Santoro 10,17851.1+11.1
Labor Dennis Williams8,60943.2−5.9
Independent Peter Dove5652.8+2.8
Indigenous Peoples Darby McCarthy 5612.8+2.8
Total formal votes19,91398.0
Informal votes3952.0
Turnout 20,30891.1
Two-party-preferred result
Liberal Santo Santoro 10,60254.1+4.1
Labor Dennis Williams9,00445.9−4.1
Liberal gain from Labor Swing +4.1

Elections in the 1970s

1974 Queensland state election: Clayfield
PartyCandidateVotes%±%
Liberal John Murray 7,61963.3+16.1
Labor John Stephens3,70130.7−9.7
Queensland Labor Francis Andrews7226.0−6.5
Total formal votes12,04298.5+0.3
Informal votes1861.5−0.3
Turnout 12,22886.0−5.8
Two-party-preferred result
Liberal John Murray 8,25368.5+10.3
Labor John Stephens3,78931.5−10.3
Liberal hold Swing +10.3
1972 Queensland state election: Clayfield
PartyCandidateVotes%±%
Liberal John Murray 5,21547.2−4.4
Labor John Stephens4,45940.4+4.0
Queensland Labor Francis Andrews1,37812.5+0.5
Total formal votes11,05298.2
Informal votes1991.8
Turnout 11,25191.8
Two-party-preferred result
Liberal John Murray 6,43658.2−4.7
Labor John Stephens4,61641.8+4.7
Liberal hold Swing −4.7

Elections in the 1960s

1969 Queensland state election: Clayfield
PartyCandidateVotes%±%
Liberal John Murray 5,06451.6−4.6
Labor David Hunter3,57836.4+3.2
Queensland Labor Francis Andrews1,17812.0+1.4
Total formal votes9,82098.5+0.7
Informal votes1541.5−0.7
Turnout 9,97489.6−2.8
Two-party-preferred result
Liberal John Murray 5,91960.3−4.6
Labor David Hunter3,90139.7+4.6
Liberal hold Swing −4.6
1966 Queensland state election: Clayfield
PartyCandidateVotes%±%
Liberal John Murray 5,68856.2+0.3
Labor Bruce Strachan3,35633.2−0.6
Queensland Labor Mary Ryan1,07410.6+0.3
Total formal votes10,11897.8−0.8
Informal votes2222.2+0.8
Turnout 10,34092.4−2.1
Two-party-preferred result
Liberal John Murray 6,56264.9+0.6
Labor Bruce Strachan3,55635.1−0.6
Liberal hold Swing +0.6
1963 Queensland state election: Clayfield
PartyCandidateVotes%±%
Liberal John Murray 5,90755.9+1.6
Labor Norm Butler3,56633.8+6.1
Queensland Labor Jack Dolan1,08510.3−7.7
Total formal votes10,55898.6+0.2
Informal votes1521.4−0.2
Turnout 10,71094.5+2.6
Two-party-preferred result
Liberal John Murray 6,79064.3
Labor Norm Butler3,76835.7
Liberal hold Swing N/A
1960 Queensland state election: Clayfield
PartyCandidateVotes%±%
Liberal Harold Taylor 5,90554.3
Labor Edgar Abel3,01527.7
Queensland Labor Harry Wright 1,95318.0
Total formal votes10,87398.4
Informal votes1721.6
Turnout 11,04591.9
Liberal hold Swing

Elections in the 1950s

1957 Queensland state election: Clayfield
PartyCandidateVotes%±%
Liberal Harold Taylor 7,44778.3+4.3
Independent James Ryan2,06521.7−4.3
Total formal votes9,51297.2−0.2
Informal votes2752.8+0.2
Turnout 9,78793.1−2.9
Liberal hold Swing +4.3
1956 Queensland state election: Clayfield
PartyCandidateVotes%±%
Liberal Harold Taylor 6,88874.0−26.0
Independent James Ryan2,42026.0+26.0
Total formal votes9,30897.4
Informal votes2442.6
Turnout 9,55290.2
Liberal hold Swing N/A
1953 Queensland state election: Clayfield
PartyCandidateVotes%±%
Liberal Harold Taylor unopposed
Liberal hold Swing
1950 Queensland state election: Clayfield
PartyCandidateVotes%±%
Liberal Harold Taylor 7,45974.6
Labor Edmund Roberts2,53925.4
Total formal votes9,99899.3
Informal votes700.7
Turnout 10,06891.7
Liberal hold Swing

Related Research Articles
<span class="mw-page-title-main">Electoral district of Clayfield</span> State electoral district of Queensland, Australia

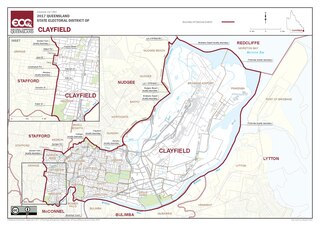
Clayfield is an electoral division of the Legislative Assembly of Queensland. It is centred on the inner northern suburb of Clayfield in the state capital of Brisbane.

This is a list of electoral results for the electoral district of Bundamba in Queensland state elections.

This is a list of electoral results for the electoral district of Burdekin in Queensland state elections.

This is a list of electoral results for the electoral district of Burleigh in Queensland state elections.

This is a list of electoral results for the electoral district of Burnett in Queensland state elections.

This is a list of electoral results for the electoral district of Cairns in Queensland state elections.

This is a list of electoral results for the electoral district of Callide in Queensland state elections.

This is a list of electoral results for the electoral district of Caloundra in Queensland state elections.

This is a list of electoral results for the electoral district of Capalaba in Queensland state elections.

This is a list of electoral results for the electoral district of Chatsworth in Queensland state elections.

This is a list of electoral results for the electoral district of Condamine in Queensland state elections.

This is a list of electoral results for the electoral district of Cook in Queensland state elections.

This is a list of electoral results for the electoral district of Coomera in Queensland state elections.

This is a list of electoral results for the electoral district of Currumbin in Queensland state elections.

This is a list of electoral results for the electoral district of Gaven in Queensland state elections.

This is a list of electoral results for the electoral district of Gladstone in the state elections of Queensland, Australia.

This is a list of electoral results for the electoral district of Inala in Queensland state elections.

This is a list of electoral results for the electoral district of Ipswich West in Queensland state elections.

This is a list of electoral results for the electoral district of Mackay in Queensland state elections.

This is a list of electoral results for the electoral district of Mundingburra in Queensland state elections.

References

  1. "Clayfield - QLD Electorate, Candidates, Results". abc.net.au. 27 October 2024. Retrieved 30 October 2024.
  2. 2020 State General Election – Clayfield – District Summary, ECQ.
  3. 2017 State General Election - Clayfield - District Summary, ECQ.
  4. 2015 State General Election - Clayfield - District Summary, ECQ.
  5. "Elections - 2012 State General Election - Clayfield - Booth Details". Archived from the original on 30 July 2012. Retrieved 21 April 2012.
  6. Green, Antony. "2009 Queensland Election: Analysis of Results" (PDF). ABC Election Unit. Retrieved 14 December 2011.