Electoral results for the district of Kallangur

Last updated

This is a list of electoral results for the electoral district of Kallangur in Queensland state elections.

Contents

Members for Kallangur

MemberPartyTerm
  Ken Hayward Labor 1992–2009
  Mary-Anne O'Neill Labor 2009–2012
  Trevor Ruthenberg Liberal National 2012–2015
  Shane King Labor 2015–2017

Election results

Elections in the 2010s

2015 Queensland state election: Kallangur [1]
PartyCandidateVotes%±%
Labor Shane King 14,28548.12+19.27
Liberal National Trevor Ruthenberg 12,23541.21−10.84
Greens Jason Kennedy3,16610.66+2.75
Total formal votes29,68697.49−0.04
Informal votes7632.51+0.04
Turnout 30,44991.18−1.06
Two-party-preferred result
Labor Shane King 16,19656.13+18.56
Liberal National Trevor Ruthenberg 12,65743.87−18.56
Labor gain from Liberal National Swing +18.56
2012 Queensland state election: Kallangur [2]
PartyCandidateVotes%±%
Liberal National Trevor Ruthenberg 13,98352.05+12.63
Labor Mary-Anne O'Neill 7,75028.85−18.16
Katter's Australian Michael Bates3,00511.19+11.19
Greens Rachel Doherty2,1257.91−0.77
Total formal votes26,86397.53−0.14
Informal votes6812.47+0.14
Turnout 27,54492.24−0.01
Two-party-preferred result
Liberal National Trevor Ruthenberg 15,18762.43+17.06
Labor Mary-Anne O'Neill 9,13837.57−17.06
Liberal National gain from Labor Swing +17.06

Elections in the 2000s

2009 Queensland state election: Kallangur [3]
PartyCandidateVotes%±%
Labor Mary-Anne O'Neill 11,87147.0−6.7
Liberal National Trevor Ruthenberg 9,95539.4+6.0
Greens Craig Graham2,1938.7−1.5
Family First Alan Revie8013.2+3.2
DS4SEQ Mark McDowell4341.7+1.7
Total formal votes25,25497.5
Informal votes6022.5
Turnout 25,85692.3
Two-party-preferred result
Labor Mary-Anne O'Neill 12,90454.6−6.4
Liberal National Trevor Ruthenberg 10,71745.4+6.4
Labor hold Swing -6.4
2006 Queensland state election: Kallangur
PartyCandidateVotes%±%
Labor Ken Hayward 14,50953.8+1.9
National Fiona Brydon9,20334.1+7.6
Greens Rachel Doherty3,26612.1+3.5
Total formal votes26,97897.2−0.3
Informal votes7722.8+0.3
Turnout 27,75092.3−0.5
Two-party-preferred result
Labor Ken Hayward 15,26960.3−3.4
National Fiona Brydon10,04239.7+3.4
Labor hold Swing -3.4
2004 Queensland state election: Kallangur
PartyCandidateVotes%±%
Labor Ken Hayward 13,09951.9−6.4
National Fay Driscoll6,68826.5+26.5
One Nation Howard Shepherd3,27513.0+13.0
Greens Suzi Tooke2,1608.6+1.3
Total formal votes25,22297.5+0.2
Informal votes6382.5−0.2
Turnout 25,86092.8−0.9
Two-party-preferred result
Labor Ken Hayward 14,26563.7−7.7
National Fay Driscoll8,14336.3+36.3
Labor hold Swing -7.7
2001 Queensland state election: Kallangur
PartyCandidateVotes%±%
Labor Ken Hayward 13,31258.3+15.6
Liberal Scott Driscoll 4,36619.1−2.9
Independent Neville Jones1,7507.7+7.7
City Country Alliance Ray Eldridge1,7407.6+7.6
Greens Suzi Tooke1,6567.3+4.4
Total formal votes22,82497.3
Informal votes6422.7
Turnout 23,46693.7
Two-party-preferred result
Labor Ken Hayward 14,16571.4+14.8
Liberal Scott Driscoll 5,68128.6−14.8
Labor hold Swing +14.8

Elections in the 1990s

1998 Queensland state election: Kallangur
PartyCandidateVotes%±%
Labor Ken Hayward 12,79742.7−5.4
One Nation Boyd Nimmo8,07726.9+26.9
Liberal Scott Driscoll 6,58322.0−14.3
Christian Democrats Howard Shepherd1,2654.2+4.2
Greens Noel Hoffman8983.0−6.8
Reform Allan Taylor1980.7+0.7
Independent Peter Birt1660.6+0.6
Total formal votes29,98498.3+0.5
Informal votes5281.7−0.5
Turnout 30,51293.7+0.9
Two-candidate-preferred result
Labor Ken Hayward 14,74553.9−0.1
One Nation Boyd Nimmo12,60846.1+46.1
Labor hold Swing -0.1
1995 Queensland state election: Kallangur
PartyCandidateVotes%±%
Labor Ken Hayward 12,57648.1−14.1
Liberal Scott Driscoll 9,49636.3−1.6
Greens Craig Josey2,5649.8+9.8
Independent Rona Joyner1,5365.9+5.9
Total formal votes26,17297.8+1.0
Informal votes5912.2−1.0
Turnout 26,76392.8
Two-party-preferred result
Labor Ken Hayward 13,62354.0−8.1
Liberal Scott Driscoll 11,60446.0+8.1
Labor hold Swing -8.1
1992 Queensland state election: Kallangur
PartyCandidateVotes%±%
Labor Ken Hayward 13,26662.1+5.9
Liberal Col Cruden8,09237.9+17.5
Total formal votes21,35896.8
Informal votes7003.2
Turnout 22,05892.2
Labor hold Swing +2.5

Related Research Articles

The Division of Dickson is an Australian Electoral Division in Queensland.

<span class="mw-page-title-main">1992 Queensland state election</span> Australian state elections; won by Labour

Elections were held in the Australian state of Queensland on 19 September 1992 to elect the 89 members of the state's Legislative Assembly.
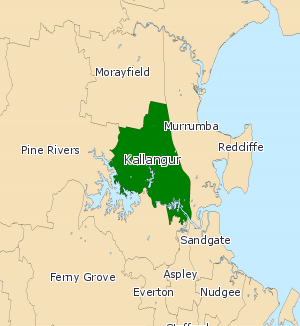
<span class="mw-page-title-main">Electoral district of Kallangur</span> Former state electoral district of Queensland, Australia

Kallangur was an electoral district of the Legislative Assembly in the Australian state of Queensland from 1992 to 2017.

<span class="mw-page-title-main">Electoral district of Kurwongbah</span> State electoral district of Queensland, Australia

Kurwongbah is an electoral district of the Legislative Assembly in the Australian state of Queensland which existed at first from 1992 to 2009, and was re-introduced for the 2017 state election. It is named after Lake Kurwongbah.The district is based in the City of Moreton Bay.
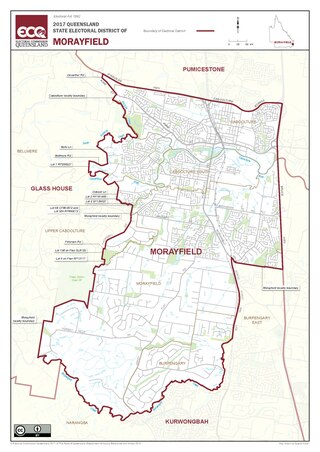
<span class="mw-page-title-main">Electoral district of Morayfield</span> State electoral district of Queensland, Australia

Morayfield is an electoral district of the Legislative Assembly in the Australian state of Queensland. It is located in the northern outskirts of Brisbane, south of the Sunshine Coast.

This is a list of electoral results for the electoral district of Algester in Queensland state elections.

This is a list of electoral results for the electoral district of Bundamba in Queensland state elections.

This is a list of electoral results for the electoral district of Chatsworth in Queensland state elections.

This is a list of electoral results for the electoral district of Currumbin in Queensland state elections.

This is a list of electoral results for the electoral district of Gaven in Queensland state elections.

This is a list of electoral results for the electoral district of Glass House in Queensland state elections.

This is a list of electoral results for the electoral district of Greenslopes in Queensland state elections.

This is a list of electoral results for the electoral district of Hervey Bay in Queensland state elections.

This is a list of electoral results for the electoral district of Mansfield in Queensland state elections.

This is a list of electoral results for the electoral district of Mulgrave in Queensland state elections.

This is a list of electoral results for the electoral district of Noosa in Queensland state elections.

This is a list of electoral results for the electoral district of Redcliffe in Queensland state elections.

This is a list of electoral results for the electoral district of Townsville in Queensland state elections.

This is a list of electoral results for the electoral district of Woodridge in Queensland state elections.

<span class="mw-page-title-main">2017 Queensland state election</span>

The 2017 Queensland state election was held on 25 November 2017 to elect all 93 members of the Legislative Assembly of Queensland, the unicameral Parliament of Queensland.

References

  1. "Elections - 2015 State General Election - Kallangur - District Summary".
  2. "Elections - 2012 State General Election - Kallangur - Booth Details". Archived from the original on 31 July 2012. Retrieved 18 May 2012.
  3. Green, Antony. "2009 Queensland Election: Analysis of Results" (PDF). ABC Election Unit. Retrieved 15 December 2011.