Electoral results for the district of Brisbane Central

Last updated

This is a list of electoral results for the electoral district of Brisbane Central in Queensland state elections.

Contents

Members for Brisbane Central

MemberPartyTerm
  Brian Davis Labor 1977–1989
  Peter Beattie Labor 1989–2007
  Grace Grace Labor 2007–2012
  Robert Cavallucci Liberal National 2012–2015
  Grace Grace Labor 2015–2017

Election results

Elections in the 2010s

2015 Queensland state election: Brisbane Central [1]
PartyCandidateVotes%±%
Liberal National Robert Cavallucci 12,04241.81−6.89
Labor Grace Grace 10,59036.77+3.10
Greens Kirsten Lovejoy5,35518.59+3.26
Independent Kai Jones8152.83+0.53
Total formal votes28,80298.36+0.01
Informal votes4811.64−0.01
Turnout 29,28384.96−1.93
Two-party-preferred result
Labor Grace Grace 14,33453.25+8.13
Liberal National Robert Cavallucci 12,58446.75−8.13
Labor gain from Liberal National Swing +8.13
2012 Queensland state election: Brisbane Central [2]
PartyCandidateVotes%±%
Liberal National Robert Cavallucci 12,20148.70+11.46
Labor Grace Grace 8,43533.67−8.49
Greens Anne Boccabella3,84215.33−1.67
Independent Ruth Bonnett5762.30+2.30
Total formal votes25,05498.35−0.15
Informal votes4201.65+0.15
Turnout 25,47486.89+0.52
Two-party-preferred result
Liberal National Robert Cavallucci 12,68954.88+10.85
Labor Grace Grace 10,43245.12−10.85
Liberal National gain from Labor Swing +10.85

Elections in the 2000s

2009 Queensland state election: Brisbane Central [3]
PartyCandidateVotes%±%
Labor Grace Grace 10,23842.2−7.7
Liberal National Mark Wood9,04237.2+8.1
Greens Anne Boccabella4,12917.0−1.5
DS4SEQ Adrian Miller8733.6+3.6
Total formal votes24,28298.3
Informal votes3711.7
Turnout 24,65386.4
Two-party-preferred result
Labor Grace Grace 12,54856.0−8.4
Liberal National Mark Wood9,87044.0+8.4
Labor hold Swing -8.4
2007 Brisbane Central state by-election
PartyCandidateVotes%±%
Labor Grace Grace 11,24850.35−0.13
Greens Anne Boccabella7,39633.11+14.83
Family First Mark A. White1,7387.78+7.78
Independent Erik Olaf Eriksen7113.18+3.18
Independent Ronald Davy6743.02+3.02
One Nation Ian Nelson5742.57+2.57
Total formal votes30,11193.21−1.16
Informal votes2,1936.79+1.16
Turnout 32,30484.93−6.86
Two-candidate-preferred result
Labor Grace Grace 11,59457.85−6.92
Greens Anne Boccabella8,44942.15+42.15
Labor hold Swing N/A
2006 Queensland state election: Brisbane Central
PartyCandidateVotes%±%
Labor Peter Beattie 13,56350.5−7.8
Liberal Craig Thomas7,74828.8+2.7
Greens Larissa Waters 4,91218.3+6.0
Independent Sam Watson5001.9+1.9
Independent Alan Skyring1450.5+0.0
Total formal votes26,86898.5+0.1
Informal votes4151.5−0.1
Turnout 27,28384.7+0.0
Two-party-preferred result
Labor Peter Beattie 15,88864.8−4.8
Liberal Craig Thomas8,64235.2+4.8
Labor hold Swing -4.8
2004 Queensland state election: Brisbane Central
PartyCandidateVotes%±%
Labor Peter Beattie 14,64458.3−6.4
Liberal Reg Little6,56326.1+5.1
Greens Richard Nielsen3,09512.3+5.4
Independent Coral Wynter3761.5+0.6
Independent Adrian McAvoy3101.2+1.2
Independent Alan Skyring1170.5−0.1
Total formal votes25,10598.4+0.3
Informal votes4031.6−0.3
Turnout 25,50884.7−3.3
Two-party-preferred result
Labor Peter Beattie 16,22169.6−5.4
Liberal Reg Little7,09330.4+5.4
Labor hold Swing -5.4
2001 Queensland state election: Brisbane Central
PartyCandidateVotes%±%
Labor Peter Beattie 14,89464.7+11.1
Liberal Joe Vasta4,83921.0−5.6
Greens Richard Nielsen1,5796.9+2.6
Independent Tamara Tonite9744.2+4.2
Independent Samuel Tornatore2010.9+0.9
Independent Coral Wynter2000.9+0.9
Independent Alan Skyring1270.6+0.6
Independent Dionne Buckley1120.5+0.5
Independent Jayson Dalton840.4+0.4
Total formal votes23,01098.1
Informal votes4411.9
Turnout 23,45188.0
Two-party-preferred result
Labor Peter Beattie 15,93675.0+10.2
Liberal Joe Vasta5,32225.0−10.2
Labor hold Swing +10.2

Elections in the 1990s

1998 Queensland state election: Brisbane Central
PartyCandidateVotes%±%
Labor Peter Beattie 10,63253.7+3.7
Liberal Tony Gleeson5,17926.2−9.4
One Nation John Beattie1,9259.7+9.7
Greens Richard Nielsen9324.7−4.7
Democrats Nicky Jones7834.0+4.0
Independent Graham Matthews3511.8+1.8
Total formal votes19,80298.5+0.5
Informal votes3081.5−0.5
Turnout 20,11089.3+2.0
Two-party-preferred result
Labor Peter Beattie 12,24165.1+4.9
Liberal Tony Gleeson6,54934.9−4.9
Labor hold Swing +4.9
1995 Queensland state election: Brisbane Central
PartyCandidateVotes%±%
Labor Peter Beattie 8,65150.0−8.7
Liberal Jason Aldworth6,15335.5+3.2
Greens Richard Nielsen1,6319.4+9.4
Independent Zanny Begg5413.1+3.1
Independent Guy McGhie3402.0+2.0
Total formal votes17,31698.0+0.5
Informal votes3572.0−0.5
Turnout 17,67387.3
Two-party-preferred result
Labor Peter Beattie 10,08960.3−4.6
Liberal Jason Aldworth6,64939.7+4.6
Labor hold Swing -4.6
1992 Queensland state election: Brisbane Central
PartyCandidateVotes%±%
Labor Peter Beattie 10,94658.7−2.1
Liberal Richard Roberts6,03032.3+6.0
Independent Susan Price1,6809.0+9.0
Total formal votes18,65697.5
Informal votes4772.5
Turnout 19,13387.3
Two-party-preferred result
Labor Peter Beattie 11,86964.8+1.9
Liberal Richard Roberts6,44035.2−1.9
Labor hold Swing +1.9

Elections in the 1980s

1989 Queensland state election: Brisbane Central
PartyCandidateVotes%±%
Labor Peter Beattie 10,82364.7+14.5
Liberal John Peeters3,45220.6+1.8
National Justin Choveaux1,5999.6−15.1
Greens Ranald McDonald8605.1+5.1
Total formal votes16,73496.4+0.7
Informal votes6303.6−0.7
Turnout 17,36484.1−1.5
Two-party-preferred result
Labor Peter Beattie 11,41368.2+9.1
Liberal John Peeters5,32131.8−9.1
Labor hold Swing +9.1
1986 Queensland state election: Brisbane Central
PartyCandidateVotes%±%
Labor Brian Davis 7,89450.2−8.7
National Peter Peters3,89924.8+24.8
Liberal Muriel Ward2,95518.8−22.3
Independent Anthony Kneipp4052.6+2.6
Socialist Jack Cotter4012.6+2.6
Independent Mark Gardener1811.2+1.2
Total formal votes15,73595.7
Informal votes7104.3
Turnout 16,44585.6
Two-party-preferred result
Labor Brian Davis 9,29959.1+0.2
National Peter Peters6,43640.9+40.9
Labor hold Swing +0.2
1983 Queensland state election: Brisbane Central
PartyCandidateVotes%±%
Labor Brian Davis 8,16458.9+5.3
Liberal Rodney Daniel5,70041.1−0.2
Total formal votes13,86496.9−0.3
Informal votes4473.1+0.3
Turnout 14,31188.7+4.4
Labor hold Swing +1.2
1980 Queensland state election: Brisbane Central
PartyCandidateVotes%±%
Labor Brian Davis 7,27953.6+0.9
Liberal Robert Wright5,60441.3−2.6
Communist Murray Broad6995.2+5.2
Total formal votes13,58297.2−0.6
Informal votes3852.8+0.6
Turnout 13,96784.3−4.0
Two-party-preferred result
Labor Brian Davis 7,83857.7+2.3
Liberal Robert Wright5,74442.3−2.3
Labor hold Swing +2.3

Elections in the 1970s

1977 Queensland state election: Brisbane Central
PartyCandidateVotes%±%
Labor Brian Davis 7,64152.7
Liberal Dennis Young 6,35943.9
Socialist Dennis Bailey4903.4
Total formal votes14,49097.8
Informal votes3292.2
Turnout 14,81988.3
Two-party-preferred result
Labor Brian Davis 8,03355.4+8.2
Liberal Dennis Young 6,45744.6−8.2
Labor gain from Liberal Swing +8.2

Related Research Articles

<span class="mw-page-title-main">Electoral district of Brisbane Central</span> Former state electoral district of Queensland, Australia

Brisbane Central was an electoral division in the state of Queensland, Australia.
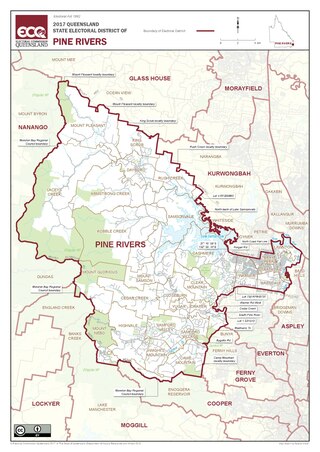
<span class="mw-page-title-main">Electoral district of Pine Rivers</span> State electoral district of Queensland, Australia

Pine Rivers is an electoral district of the Legislative Assembly in the Australian state of Queensland.
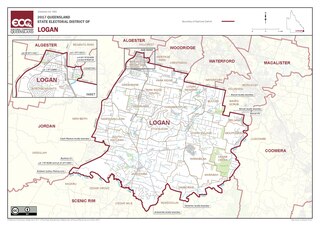
<span class="mw-page-title-main">Electoral district of Logan</span> State electoral district of Queensland, Australia

Logan is an electoral district in southern Queensland, Australia.
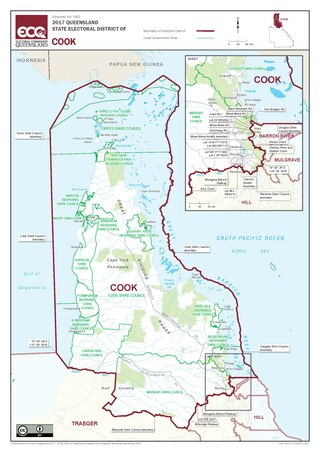
<span class="mw-page-title-main">Electoral district of Cook</span> State electoral district of Queensland, Australia

Cook is an electoral district in Queensland, Australia.
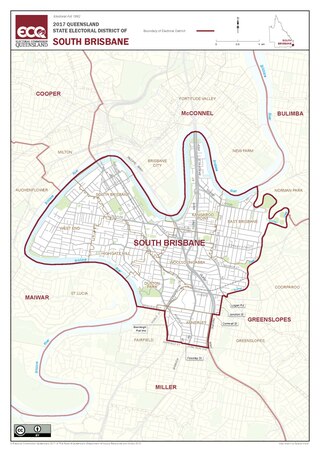
<span class="mw-page-title-main">Electoral district of South Brisbane</span> State electoral district of Queensland, Australia

South Brisbane, also known as Brisbane South, is an electoral district of the Legislative Assembly of Queensland. The electorate encompasses suburbs in Brisbane's inner-south, stretching from East Brisbane to West End, and south to Annerley. Parts of Greenslopes and Coorparoo are also located in the electorate.
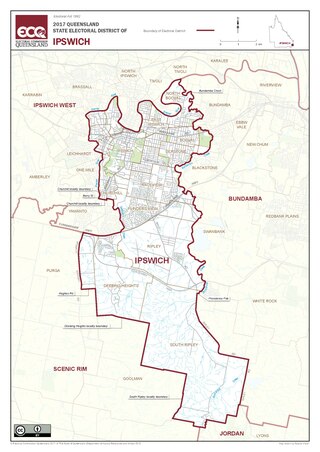
<span class="mw-page-title-main">Electoral district of Ipswich</span> State electoral district of Queensland, Australia

Ipswich is a Legislative Assembly of Queensland electoral district on the Brisbane River, west of Brisbane in the Australian state of Queensland. The electorate includes Ipswich and its suburbs, south and east of the Bremer River, west of Bundamba Creek and north of the Cunningham Highway.
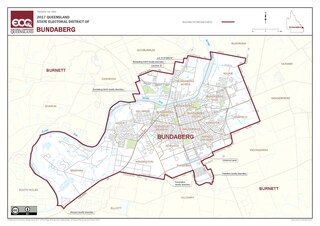
<span class="mw-page-title-main">Electoral district of Bundaberg</span> State electoral district of Queensland, Australia

Bundaberg is an electoral district of the Legislative Assembly of Queensland in central Queensland, Australia. It covers the city of Bundaberg, as well as the immediate surrounding area.

<span class="mw-page-title-main">Electoral district of Ferny Grove</span> State electoral district of Queensland, Australia

Ferny Grove is one of the 89 electoral districts for the Legislative Assembly of Queensland in Australia. Located in northwest Brisbane, it is named for the suburb of Ferny Grove. It was first created in 1992, and was represented by Labor from its creation until the 2012 election, in which the LNP won with a 59.5 percent two-party vote.

<span class="mw-page-title-main">Electoral district of Mansfield</span> State electoral district of Queensland, Australia

Mansfield is an electoral district of the Legislative Assembly in the Australian state of Queensland.

West Moreton was the name of two incarnations of an electoral district of the Legislative Assembly in the Australian state of Queensland.

Windsor was an electoral district of the Legislative Assembly in the Australian state of Queensland from 1912 to 1992.

Brisbane was an electoral district of the Legislative Assembly in the Australian state of Queensland from 1912 to 1977.

Brisbane City was an electoral district of the Legislative Assembly in the Australian state of Queensland from 1873 to 1878.

Merthyr was an electoral district of the Legislative Assembly in the Australian state of Queensland from 1912 to 1992.

This is a list of electoral results for the electoral district of Rockhampton in Queensland state elections.

This is a list of electoral results for the electoral district of South Brisbane in Queensland state elections.

This is a list of electoral results for the electoral district of Warrego in Queensland state elections.

Baroona was an electoral district of the Legislative Assembly in the Australian state of Queensland from 1935 to 1977.
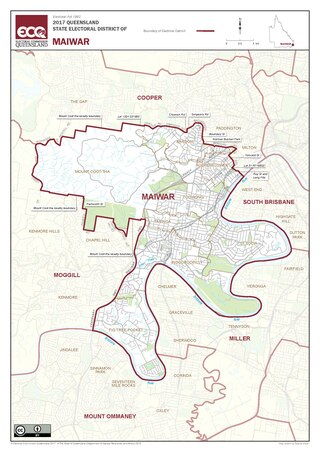
<span class="mw-page-title-main">Electoral district of Maiwar</span> State electoral district of Queensland, Australia

Maiwar is an electoral district of the Legislative Assembly in the Australian state of Queensland, incorporating the inner western suburbs of Brisbane. It was created in the 2017 redistribution, and was first contested at the 2017 Queensland state election. The name of the electorate is stated by the government as being based on an Aboriginal name for the Brisbane River, however it is not the name that the Turrbal people who lived in the Brisbane region had for the river. The Brisbane River forms the southern boundary of the electorate.
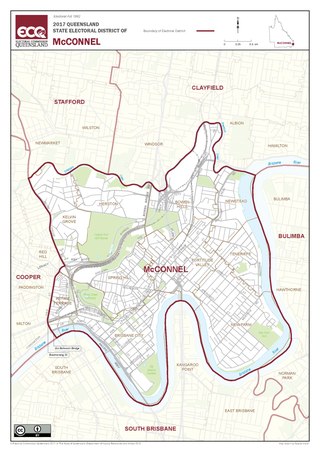
<span class="mw-page-title-main">Electoral district of McConnel</span> State electoral district of Queensland, Australia

McConnel is an electoral district of the Legislative Assembly in the Australian state of Queensland. It was created in the 2017 redistribution as essentially a reconfigured version of Brisbane Central.

References

  1. 2015 State General Election - Brisbane Central - District Summary, ECQ.
  2. "Elections - 2012 State General Election - Brisbane Central - Booth Details". Archived from the original on 28 July 2012. Retrieved 20 April 2012.
  3. Green, Antony. "2009 Queensland Election: Analysis of Results" (PDF). ABC Election Unit. Retrieved 14 December 2011.