This is a list of electoral results for the electoral district of Dalby in Queensland state elections.
Member | Party | Term | |
---|---|---|---|
Joshua Peter Bell | Unaligned | 1873–1878 | |
George Simpson | Unaligned | 1878–1882 | |
John Jessop | Unaligned | 1882–1893 | |
Joshua Thomas Bell | Ministerialist | 1893–1911 | |
William Vowles | Ministerialist/Liberal/National/Country | 1911–1926 | |
Wilfred Adams Russell | PPC/Country | 1926–1932 | |
Jim Sparkes | Country | 1932–1935 | |
Godfrey Morgan | Country | 1935–1938 | |
Aubrey Slessar | Labor | 1938–1947 | |
Charles Russell | Country | 1947–1949 | |
Party | Candidate | Votes | % | ±% | |
---|---|---|---|---|---|
Country | Charles Russell | 5,736 | 59.1 | +10.6 | |
Labor | George Wilkes | 3,977 | 40.9 | −10.6 | |
Total formal votes | 9,713 | 98.8 | +4.4 | ||
Informal votes | 122 | 1.2 | −4.4 | ||
Turnout | 9,835 | 89.3 | +0.8 | ||
Country gain from Labor | Swing | +10.6 | |||
Party | Candidate | Votes | % | ±% | |
---|---|---|---|---|---|
Labor | Aubrey Slessar | 4,688 | 51.5 | −4.5 | |
Country | Charles Russell | 4,409 | 48.5 | +4.5 | |
Total formal votes | 9,097 | 94.4 | −4.8 | ||
Informal votes | 537 | 5.6 | +4.8 | ||
Turnout | 9,634 | 88.5 | +1.4 | ||
Labor hold | Swing | -4.5 | |||
Party | Candidate | Votes | % | ±% | |
---|---|---|---|---|---|
Labor | Aubrey Slessar | 5,434 | 56.0 | +5.7 | |
Country | Godfrey Morgan | 4,262 | 44.0 | −5.7 | |
Total formal votes | 9,696 | 99.2 | +0.3 | ||
Informal votes | 74 | 0.8 | −0.3 | ||
Turnout | 9,770 | 87.1 | −4.6 | ||
Labor hold | Swing | +5.7 | |||
Party | Candidate | Votes | % | ±% | |
---|---|---|---|---|---|
Labor | William King | 5,201 | 53.3 | −16.6 | |
United Australia | William Carter | 3,830 | 39.2 | +9.1 | |
Social Credit | Charles Martin | 727 | 7.5 | +7.5 | |
Total formal votes | 9,758 | 98.7 | +1.4 | ||
Informal votes | 128 | 1.3 | −1.4 | ||
Turnout | 9,886 | 94.4 | +0.6 | ||
Labor hold | Swing | N/A | |||
Party | Candidate | Votes | % | ±% | |
---|---|---|---|---|---|
CPNP | Godfrey Morgan | 4,373 | 51.8 | ||
Labor | George Wilkes | 4,061 | 48.2 | ||
Total formal votes | 8,434 | 99.0 | |||
Informal votes | 84 | 1.0 | |||
Turnout | 8,518 | 93.1 | |||
CPNP hold | Swing | ||||
Party | Candidate | Votes | % | ±% | |
---|---|---|---|---|---|
CPNP | Jim Sparkes | 3,904 | 53.8 | ||
Labor | Adolphus Baker | 3,349 | 46.2 | ||
Total formal votes | 7,253 | 99.2 | |||
Informal votes | 56 | 0.8 | |||
Turnout | 7,309 | 93.3 | |||
CPNP hold | Swing | ||||
Party | Candidate | Votes | % | ±% | |
---|---|---|---|---|---|
CPNP | Wilfred Russell | 3,511 | 65.9 | +38.3 | |
Labor | Clive Curtis | 1,816 | 34.1 | +3.0 | |
Total formal votes | 5,327 | ||||
Informal votes | |||||
Turnout | |||||
CPNP gain from Independent | Swing | N/A | |||
Party | Candidate | Votes | % | ±% | |
---|---|---|---|---|---|
Primary Producers | Wilfred Russell | 2,347 | 41.4 | +41.4 | |
Labor | Harold Francis | 1,762 | 31.1 | −6.6 | |
CPNP | William Vowles | 1,563 | 27.6 | −21.2 | |
Total formal votes | 5,672 | 98.9 | +1.0 | ||
Informal votes | 64 | 1.1 | −1.0 | ||
Turnout | 5,736 | 91.2 | +6.5 | ||
Two-candidate-preferred result | |||||
Primary Producers | Wilfred Russell | 3,529 | 65.7 | +65.7 | |
Labor | Harold Francis | 1,842 | 34.3 | +7.2 | |
Primary Producers gain from CPNP | Swing | N/A | |||
Party | Candidate | Votes | % | ±% | |
---|---|---|---|---|---|
Country | William Vowles | 2,679 | 48.8 | −13.7 | |
Labor | Hugh McAnally | 2,069 | 37.7 | +0.2 | |
Independent Country | N C Hooper | 743 | 13.5 | +13.5 | |
Total formal votes | 5,491 | 97.9 | −1.4 | ||
Informal votes | 120 | 2.1 | +1.4 | ||
Turnout | 5,611 | 84.7 | +0.8 | ||
Two-party-preferred result | |||||
Country | William Vowles | 3,086 | 58.1 | −4.4 | |
Labor | Hugh McAnally | 2,221 | 41.9 | +4.4 | |
Country hold | Swing | -4.4 | |||
Party | Candidate | Votes | % | ±% | |
---|---|---|---|---|---|
Country | William Vowles | 3,005 | 62.5 | +62.5 | |
Labor | James Connolly | 1,804 | 37.5 | −5.6 | |
Total formal votes | 4,849 | 99.3 | −0.1 | ||
Informal votes | 35 | 0.7 | +0.1 | ||
Turnout | 4,884 | 83.9 | +4.1 | ||
Country gain from National | Swing | N/A | |||
Party | Candidate | Votes | % | ±% | |
---|---|---|---|---|---|
National | William Vowles | 2,686 | 56.9 | +23.3 | |
Labor | Austin McKeon | 2,033 | 43.1 | +0.6 | |
Total formal votes | 4,719 | 99.4 | +1.5 | ||
Informal votes | 28 | 0.6 | −1.5 | ||
Turnout | 4,747 | 79.8 | −4.7 | ||
National hold | Swing | +3.7 | |||
Party | Candidate | Votes | % | ±% | |
---|---|---|---|---|---|
Labor | John Connolly | 1,788 | 42.5 | −0.4 | |
Liberal | William Vowles | 1,414 | 33.6 | −23.5 | |
Farmers' Union | Frederick Bradhurst | 1,004 | 23.9 | +23.9 | |
Total formal votes | 4,206 | 97.9 | −1.6 | ||
Informal votes | 89 | 2.1 | +1.6 | ||
Turnout | 4,295 | 84.5 | +9.1 | ||
Two-party-preferred result | |||||
Liberal | William Vowles | 2,165 | 53.2 | −3.9 | |
Labor | John Connolly | 1,902 | 46.8 | +3.9 | |
Liberal hold | Swing | -3.9 | |||
Party | Candidate | Votes | % | ±% | |
---|---|---|---|---|---|
Liberal | William Vowles | 1,992 | 57.1 | ||
Labor | Robert Turnbull | 1,497 | 42.9 | ||
Total formal votes | 3,489 | 99.5 | |||
Informal votes | 19 | 0.5 | |||
Turnout | 3,508 | 75.4 | |||
Liberal hold | Swing | ||||
The lower houses of the parliaments of the states and territories of Australia are divided into electoral districts. Most electoral districts send a single member to a state or territory's parliament using the preferential method of voting. The area of a state electoral district is dependent upon the Electoral Acts in the various states and vary in area between them. At present, there are 409 state electoral districts in Australia.
Colin Anfield Hughes was a distinguished British-Australian academic specialising in electoral politics and government. He was Emeritus professor of political science at the University of Queensland, and chairman of the Queensland Constitutional Review Commission (1999–2000).
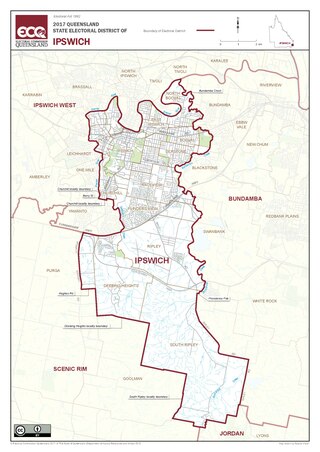
Ipswich is a Legislative Assembly of Queensland electoral district on the Brisbane River, west of Brisbane in the Australian state of Queensland. The electorate includes Ipswich and its suburbs, south and east of the Bremer River, west of Bundamba Creek and north of the Cunningham Highway.
This is a list of electoral results for the electoral district of Albert in Queensland state elections.
This is a list of electoral results for the electoral district of Logan in Queensland state elections.
This is a list of electoral results for the electoral district of Mackay in Queensland state elections.
This is a list of electoral results for the electoral district of Aubigny in Queensland state elections.
This is a list of electoral results for the electoral district of Townsville South in Queensland state elections.
This is a list of electoral results for the electoral district of Coorparoo in Queensland state elections.
This is a list of electoral results for the electoral district of Maree in Queensland state elections.
This is a list of electoral results for the electoral district of Darlington in Queensland state elections.
This is a list of electoral results for the electoral district of East Toowoomba in Queensland state elections.
This is a list of electoral results for the electoral district of Hamilton in Queensland state elections.
This is a list of electoral results for the electoral district of Haughton in Queensland state elections.
This is a list of electoral results for the electoral district of Marodian in Queensland state elections.
This is a list of electoral results for the electoral district of Mackenzie in Queensland state elections.
This is a list of electoral results for the electoral district of Nash in Queensland state elections.
This is a list of electoral results for the electoral district of Townsville North in Queensland state elections.
This is a list of electoral results for the electoral district of Norman in Queensland state elections.
This is a list of electoral results for the electoral district of Ipswich East in Queensland state elections.