Related Research Articles
The electoral system of Australia comprises the laws and processes used for the election of members of the Australian Parliament and is governed primarily by the Commonwealth Electoral Act 1918. The system presently has a number of distinctive features including compulsory enrolment; compulsory voting; majority-preferential instant-runoff voting in single-member seats to elect the lower house, the House of Representatives; and the use of the single transferable vote proportional representation system to elect the upper house, the Senate.
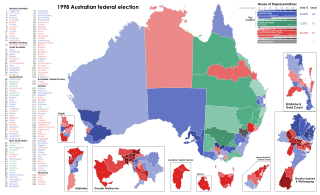
The 1998 Australian federal election was held to determine the members of the 39th Parliament of Australia. It was held on 3 October 1998. All 148 seats of the House of Representatives and 40 seats of the 76-seat Senate were up for election. The incumbent centre-right Liberal/National Coalition government led by Prime Minister John Howard of the Liberal Party and coalition partner Tim Fischer of the National Party defeated the centre-left Australian Labor Party opposition led by Opposition Leader Kim Beazley, despite losing the nationwide popular and two-party preferred vote. However, the Australian Labor Party gained seats from the previous election.
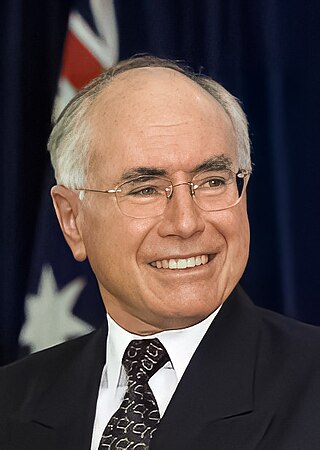
The 2004 Australian federal election was held in Australia on 9 October 2004. All 150 seats in the House of Representatives and 40 seats in the 76-member Senate were up for election. The incumbent Liberal Party of Australia led by Prime Minister of Australia John Howard and coalition partner the National Party of Australia led by John Anderson defeated the opposition Australian Labor Party led by Mark Latham.

The Division of Bennelong is an Australian electoral division in the state of New South Wales. The division was created in 1949 and is named after Woollarawarre Bennelong, an Aboriginal man befriended by the first Governor of New South Wales, Arthur Phillip. The seat is represented by Jerome Laxale since the 2022 Australian federal election.
The term swing refers to the extent of change in voter support, typically from one election or opinion poll to another, expressed as a positive or negative percentage point. For the Australian House of Representatives and the lower or unicameral houses of the parliaments of all the states and territories except Tasmania and the ACT, as well as Tasmania's upper house, Australia employs preferential voting in single-member constituencies. Under the full-preference instant-runoff voting system, in each seat the candidate with the lowest vote is eliminated and their preferences are distributed, which is repeated until only two candidates remain. While every seat has a two-candidate preferred (TCP) result, seats where the major parties have come first and second are commonly referred to as having a two-party-preferred (TPP) result. The concept of "swing" in Australian elections is not simply a function of the difference between the votes of the two leading candidates, as it is in Britain. To know the majority of any seat, and therefore the swing necessary for it to change hands, it is necessary to know the preferences of all the voters, regardless of their first preference votes. It is not uncommon in Australia for candidates who have comfortable leads on the first count to fail to win the seat, because "preference flows" go against them.

Prahran is an electoral district of the Legislative Assembly in the Australian state of Victoria. It was created by the Electoral Act Amendment Act 1888, taking effect at the 1889 elections. The electorate is the state’s smallest by area, covering a little under 11 km2 in the inner south-east of Melbourne. It includes the suburbs of South Yarra, Prahran and Windsor, as well as parts of Southbank, St Kilda and St Kilda East.

In Australian politics, the two-party-preferred vote is the result of an election or opinion poll after preferences have been distributed to the highest two candidates, who in some cases can be independents. For the purposes of TPP, the Liberal/National Coalition is usually considered a single party, with Labor being the other major party. Typically the TPP is expressed as the percentages of votes attracted by each of the two major parties, e.g. "Coalition 50%, Labor 50%", where the values include both primary votes and preferences. The TPP is an indicator of how much swing has been attained/is required to change the result, taking into consideration preferences, which may have a significant effect on the result.

The 2002 Cunningham by-election was held in the Australian electorate of Cunningham in New South Wales on 19 October 2002. The by-election was triggered by the resignation of the sitting member, the Australian Labor Party's Stephen Martin on 16 August 2002. The writ for the by-election was issued on 16 September 2002.
This is a list of electoral results for the Electoral district of Kavel in South Australian state elections.
This is a list of electoral results for the Electoral district of Lowan in Victorian state elections.
This is a list of electoral results for the Electoral district of Rodney in Victorian state elections.
This is a list of electoral results for the Electoral district of Swan Hill in Victorian state elections.
This is a list of electoral results for the electoral district of Warrnambool in Victorian state elections.
This is a list of House of Assembly results for the 1975 South Australian state election.
Glenn James Butcher is an Australian politician currently serving as the Queensland Minister for Regional Development and Manufacturing and Minister for Water. He previously served as the Assistant Minister for Local Government and Infrastructure and Assistant Minister for Transport and Infrastructure respectively. He has been the Labor member for Gladstone in the Queensland Legislative Assembly since 2015.

The 2021 Western Australian state election was held on Saturday, March 13, to elect members to the Parliament of Western Australia, where all 59 seats in the Legislative Assembly and all 36 seats in the Legislative Council were up for election.
This is a list of electoral district results for the Victorian 1988 election for the Legislative Assembly.

A by-election was held in the New South Wales state electoral district of Wagga Wagga on 8 September 2018. The by-election was triggered by the resignation of Daryl Maguire, a Liberal-turned-independent. Maguire resigned from Parliament the previous month after admitting to a corruption inquiry that he sought payment over a property deal.
This is a list of electoral district results for the 1974 Queensland state election.
The number of seats won by each party in the Australian House of Representatives at the 2022 federal election were: Coalition 58, Labor 77, Australian Greens 4, Centre Alliance 1, Katter's Australian Party 1, and Independents 10.
References
- ↑ "Cunningham - 2006 - Election Archive". ABC News . Australian Broadcasting Corporation. Archived from the original on 25 September 2012. Retrieved 10 April 2020.