This is a list of electoral results for the electoral district of Yeronga in Queensland state elections.
Member | Party | Term | |
---|---|---|---|
Winston Noble | Liberal | 1950–1964 | |
Norm Lee | Liberal | 1964–1989 | |
Matt Foley | Labor | 1989–2001 | |
Party | Candidate | Votes | % | ±% | |
---|---|---|---|---|---|
Labor | Matt Foley | 9,979 | 52.63 | +1.71 | |
Liberal | John Webster | 5,323 | 28.08 | −13.28 | |
One Nation | Vanessa Pacitto | 2,532 | 13.36 | +13.36 | |
Greens | Stephen Burchall | 1,006 | 5.31 | +5.31 | |
Reform | Rick Stapleton | 119 | 0.63 | +0.63 | |
Total formal votes | 18,959 | 98.58 | +0.40 | ||
Informal votes | 274 | 1.42 | −0.40 | ||
Turnout | 19,233 | 92.82 | +1.51 | ||
Two-party-preferred result | |||||
Labor | Matt Foley | 11,218 | 62.47 | +7.87 | |
Liberal | John Webster | 6,739 | 37.53 | −7.87 | |
Labor hold | Swing | +7.87 | |||
Party | Candidate | Votes | % | ±% | |
---|---|---|---|---|---|
Labor | Matt Foley | 9,466 | 50.92 | −12.55 | |
Liberal | Salli Aitken | 7,689 | 41.36 | +4.83 | |
Independent | Bernadette Le Goullon | 966 | 5.20 | +5.20 | |
Confederate Action | Leonce Kealy | 468 | 2.52 | +2.52 | |
Total formal votes | 18,589 | 98.18 | +0.79 | ||
Informal votes | 345 | 1.82 | −0.79 | ||
Turnout | 18,934 | 91.31 | −0.18 | ||
Two-party-preferred result | |||||
Labor | Matt Foley | 10,003 | 54.60 | −8.87 | |
Liberal | Salli Aitken | 8,316 | 45.40 | +8.87 | |
Labor hold | Swing | -8.87 | |||
Party | Candidate | Votes | % | ±% | |
---|---|---|---|---|---|
Labor | Matt Foley | 12,410 | 63.5 | +4.3 | |
Liberal | Iain Moore | 7,142 | 36.5 | +6.8 | |
Total formal votes | 19,552 | 97.4 | |||
Informal votes | 524 | 2.6 | |||
Turnout | 20,076 | 91.5 | |||
Labor hold | Swing | +2.9 | |||
Party | Candidate | Votes | % | ±% | |
---|---|---|---|---|---|
Labor | Matt Foley | 11,043 | 58.4 | +18.1 | |
Liberal | Cliff Dee | 6,067 | 32.1 | +2.7 | |
National | Gordon Fisher | 1,798 | 9.5 | −14.7 | |
Total formal votes | 18,908 | 97.8 | −0.1 | ||
Informal votes | 418 | 2.2 | +0.1 | ||
Turnout | 19,326 | 92.0 | +0.3 | ||
Two-party-preferred result | |||||
Labor | Matt Foley | 11,175 | 59.1 | +14.8 | |
Liberal | Cliff Dee | 7,733 | 40.9 | −14.8 | |
Labor gain from Liberal | Swing | +14.8 | |||
Party | Candidate | Votes | % | ±% | |
---|---|---|---|---|---|
Labor | John Mickel | 7,396 | 40.3 | −6.8 | |
Liberal | Norm Lee | 5,386 | 29.4 | −23.5 | |
National | Peter Castrisos | 4,430 | 24.2 | +24.2 | |
Independent | Kitchener Farrell | 1,125 | 6.1 | +6.1 | |
Total formal votes | 18,337 | 97.9 | +0.2 | ||
Informal votes | 389 | 2.1 | −0.2 | ||
Turnout | 18,726 | 91.7 | −1.0 | ||
Two-party-preferred result | |||||
Liberal | Norm Lee | 10,213 | 55.7 | +1.3 | |
Labor | John Mickel | 8,124 | 44.3 | −1.3 | |
Liberal hold | Swing | +1.3 | |||
Party | Candidate | Votes | % | ±% | |
---|---|---|---|---|---|
Liberal | Norm Lee | 7,788 | 52.9 | −4.1 | |
Labor | Kitchener Farrell | 6,932 | 47.1 | +4.1 | |
Total formal votes | 14,720 | 97.7 | −0.3 | ||
Informal votes | 343 | 2.3 | +0.3 | ||
Turnout | 15,063 | 92.7 | +2.3 | ||
Liberal hold | Swing | -4.1 | |||
Party | Candidate | Votes | % | ±% | |
---|---|---|---|---|---|
Liberal | Norm Lee | 8,283 | 57.0 | +2.3 | |
Labor | Kitchener Farrell | 6,237 | 43.0 | +2.5 | |
Total formal votes | 14,520 | 98.0 | −0.5 | ||
Informal votes | 300 | 2.0 | +0.5 | ||
Turnout | 14,820 | 90.4 | −1.8 | ||
Liberal hold | Swing | -1.1 | |||
Party | Candidate | Votes | % | ±% | |
---|---|---|---|---|---|
Liberal | Norm Lee | 8,110 | 54.7 | −10.8 | |
Labor | Lance Maguire | 6,005 | 40.5 | +8.9 | |
Progress | Peter Stevenson | 721 | 4.9 | +4.9 | |
Total formal votes | 14,836 | 98.5 | |||
Informal votes | 220 | 1.5 | |||
Turnout | 15,056 | 92.2 | |||
Two-party-preferred result | |||||
Liberal | Norm Lee | 8,615 | 58.1 | −10.2 | |
Labor | Lance Maguire | 6,221 | 41.9 | +10.2 | |
Liberal hold | Swing | -10.2 | |||
Party | Candidate | Votes | % | ±% | |
---|---|---|---|---|---|
Liberal | Norm Lee | 7,954 | 65.5 | +17.2 | |
Labor | Spencer Higgins | 3,842 | 31.6 | −13.3 | |
Queensland Labor | Andrew Jackson | 354 | 2.9 | −3.8 | |
Total formal votes | 12,150 | 98.6 | −0.1 | ||
Informal votes | 174 | 1.4 | +0.1 | ||
Turnout | 12,324 | 89.0 | −5.3 | ||
Two-party-preferred result | |||||
Liberal | Norm Lee | 8,248 | 67.9 | +13.6 | |
Labor | Spencer Higgins | 3,902 | 32.1 | −13.6 | |
Liberal hold | Swing | +13.6 | |||
Party | Candidate | Votes | % | ±% | |
---|---|---|---|---|---|
Liberal | Norm Lee | 5,546 | 48.3 | −1.2 | |
Labor | Clem Jones | 5,156 | 44.9 | +5.2 | |
Queensland Labor | Harry Wright | 770 | 6.7 | −4.0 | |
Total formal votes | 11,472 | 98.7 | |||
Informal votes | 156 | 1.3 | |||
Turnout | 11,628 | 94.3 | |||
Two-party-preferred result | |||||
Liberal | Norm Lee | 6,234 | 54.3 | −5.7 | |
Labor | Clem Jones | 5,238 | 45.7 | +5.7 | |
Liberal hold | Swing | -5.7 | |||
Party | Candidate | Votes | % | ±% | |
---|---|---|---|---|---|
Liberal | Norm Lee | 5,311 | 49.5 | −1.5 | |
Labor | Malcolm Campbell | 4,261 | 39.7 | +0.9 | |
Queensland Labor | Jonyth Mapstone | 1,149 | 10.7 | +0.4 | |
Total formal votes | 10,721 | 98.5 | +0.1 | ||
Informal votes | 159 | 1.5 | −0.1 | ||
Turnout | 10,880 | 93.1 | −1.6 | ||
Two-party-preferred result | |||||
Liberal | Norm Lee | 6,280 | 58.6 | −0.7 | |
Labor | Malcolm Campbell | 4,441 | 41.4 | +0.7 | |
Liberal hold | Swing | -0.7 | |||
Party | Candidate | Votes | % | ±% | |
---|---|---|---|---|---|
Liberal | Norm Lee | 5,499 | 51.0 | −1.2 | |
Labor | Jack Davis | 4,180 | 38.8 | +1.9 | |
Queensland Labor | John Lamberth | 1,106 | 10.3 | +0.2 | |
Total formal votes | 10,785 | 98.4 | −0.1 | ||
Informal votes | 177 | 1.6 | +0.1 | ||
Turnout | 10,962 | 94.7 | −0.2 | ||
Two-party-preferred result | |||||
Liberal | Norm Lee | 6,399 | 59.3 | −0.7 | |
Labor | Jack Davis | 4,386 | 40.7 | +0.7 | |
Liberal hold | Swing | -0.7 | |||
Party | Candidate | Votes | % | ±% | |
---|---|---|---|---|---|
Liberal | Winston Noble | 5,621 | 52.2 | +0.8 | |
Labor | Cyril Cusack | 3,970 | 36.9 | −0.7 | |
Queensland Labor | Mary Andrews | 1,089 | 10.1 | −0.9 | |
Social Credit | Roy Phipps | 81 | 0.8 | +0.8 | |
Total formal votes | 10,761 | 98.5 | −0.4 | ||
Informal votes | 158 | 1.5 | +0.4 | ||
Turnout | 10,919 | 94.9 | +1.0 | ||
Two-party-preferred result | |||||
Liberal | Winston Noble | 6,452 | 60.0 | ||
Labor | Cyril Cusack | 4,309 | 40.0 | ||
Liberal hold | Swing | N/A | |||
Party | Candidate | Votes | % | ±% | |
---|---|---|---|---|---|
Liberal | Winston Noble | 5,594 | 51.4 | ||
Labor | John O'Donnell | 4,085 | 37.6 | ||
Queensland Labor | Francis Wickings | 1,196 | 11.0 | ||
Total formal votes | 10,875 | 98.9 | |||
Informal votes | 124 | 1.1 | |||
Turnout | 10,999 | 93.9 | |||
Liberal hold | Swing | ||||
Party | Candidate | Votes | % | ±% | |
---|---|---|---|---|---|
Liberal | Winston Noble | 6,660 | 54.6 | −3.3 | |
Labor | Roy Dent | 2,903 | 23.8 | −16.7 | |
Queensland Labor | William Quaill | 2,635 | 21.6 | +21.6 | |
Total formal votes | 12,198 | 99.2 | +0.2 | ||
Informal votes | 98 | 0.8 | −0.2 | ||
Turnout | 12,296 | 95.7 | +1.6 | ||
Liberal hold | Swing | +10.7 | |||
Party | Candidate | Votes | % | ±% | |
---|---|---|---|---|---|
Liberal | Winston Noble | 6,974 | 57.9 | +6.2 | |
Labor | Norman Stutz | 4,875 | 40.5 | −8.3 | |
Independent | Jim Dwyer | 191 | 1.6 | +1.6 | |
Total formal votes | 12,040 | 99.0 | +0.2 | ||
Informal votes | 116 | 1.0 | −0.2 | ||
Turnout | 12,156 | 94.1 | −1.2 | ||
Liberal hold | Swing | +7.5 | |||
Party | Candidate | Votes | % | ±% | |
---|---|---|---|---|---|
Liberal | Winston Noble | 6,041 | 51.2 | −7.6 | |
Labor | Tom Doyle | 5,767 | 48.8 | +7.6 | |
Total formal votes | 11,808 | 98.8 | +0.3 | ||
Informal votes | 146 | 1.2 | −0.3 | ||
Turnout | 11,954 | 95.3 | +1.7 | ||
Liberal hold | Swing | -7.6 | |||
Party | Candidate | Votes | % | ±% | |
---|---|---|---|---|---|
Liberal | Winston Noble | 6,504 | 58.8 | ||
Labor | Thomas Doyle | 4,550 | 41.2 | ||
Total formal votes | 11,054 | 98.5 | |||
Informal votes | 164 | 1.5 | |||
Turnout | 11,218 | 93.6 | |||
Liberal hold | Swing | ||||
Yeronga railway station is located on the Beenleigh line in Queensland, Australia. It serves the Brisbane suburb of Yeronga.
The Division of Moreton is an Australian Electoral Division in Queensland.
The 2001 Queensland state election was held on 17 February 2001 to elect the 89 members of the state's Legislative Assembly. The result of the election was the return of the Labor Party (ALP) government of Premier Peter Beattie, with an increased majority in a landslide. Labor won 66 seats, easily the most it has ever won in Queensland and one of Labor's best-ever results nationwide. There was a 10.07% swing towards Labor, while One Nation suffered a 13.98% swing against it, losing eight seats.
This is a list of current and former electoral divisions for the Legislative Assembly of Queensland, the state legislature for Queensland, Australia.
Yeronga is a southern riverside suburb in the City of Brisbane, Queensland, Australia. In the 2021 census, Yeronga had a population of 7,062 people.
Yeronga Memorial Park is a heritage-listed park at Ipswich Road, Yeronga, City of Brisbane, Queensland, Australia. The park has an area of 224,600 square metres (2,418,000 sq ft) and is one of the oldest in Brisbane, having been established in 1882, and has been a World War I memorial since 1917. It was added to the Queensland Heritage Register on 2 December 2005.
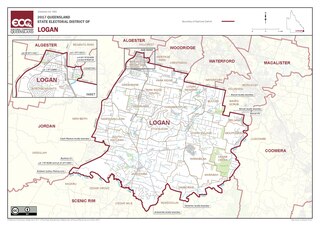
Logan is an electoral district in southern Queensland, Australia.
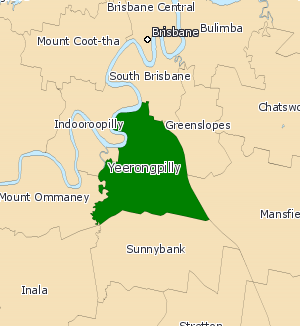
Yeerongpilly was a Legislative Assembly electorate the state of Queensland. Named for the suburb with the same name, the electorate was renamed before the 2001 elections from the previous name of Yeronga. In 2017, it was abolished and replaced by the electoral district of Miller.
Ipswich Road is major road in the City of Brisbane, Queensland, Australia. The road has been an important transport route since the 19th century when it connected the towns of Brisbane and Ipswich. In the 1990s, the section from Moorooka in Brisbane to Riverview in Ipswich was replaced by the Ipswich Motorway.
Yeronga was an electoral district of the Legislative Assembly in the Australian state of Queensland from 1950 to 2001.
Kurilpa was a Legislative Assembly electorate in the state of Queensland from 1912 to 1986. It was named for the Kurilpa Peninsula on the Brisbane River. Until 1960, it was based in the inner southern Brisbane suburbs of West End and the western parts of South Brisbane, but after that, it also included Dutton Park, Fairfield, Highgate Hill and parts of Yeronga and Annerley.
This is a list of members of the 37th Legislative Assembly of Queensland from 1963 to 1966, as elected at the 1963 state election held on 1 June 1963.
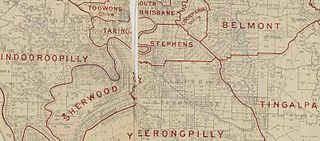
The Shire of Stephens was a local government area in the inner southern suburbs of Brisbane, Queensland, Australia. The shire, administered from Annerley, covered an area of 9 square miles (23 km2), and existed as a local government entity from 1886 until 1925, when it was amalgamated into the City of Brisbane under the City of Brisbane Act 1924.
The Yeronga South Brisbane Football Club, often known simply as Yeronga and nicknamed the Devils, is an Australian rules football club that plays in Division 2 of the Queensland Football Association (QFA) men's leagues and in the AFL Queensland Women's League (QAFLW). The club has previously competed in the Queensland Australian National Football League (QANFL).
Norman Edward Lee was an Australian politician. He was a Member of the Queensland Legislative Assembly.
Oxley was a Legislative Assembly electorate in the state of Queensland.
Tennyson Ward is a Brisbane City Council ward covering Tennyson, Chelmer, Corinda, Fairfield, Graceville, Sherwood, Yeerongpilly and Yeronga, and parts of Annerley and Oxley.
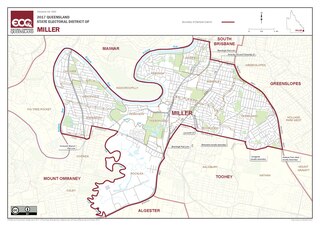
Miller is an electoral district of the Legislative Assembly in the Australian state of Queensland. It was created in the 2017 redistribution. It was named after Emma Miller, a labour and suffrage activist and is represented by Mark Bailey of the Labor Party.
Yeronga State School is a heritage-listed state school at 150 Park Road, Yeronga, City of Brisbane, Queensland, Australia. Its buildings were designed by Department of Public Works (Queensland), Thomas Robert Gladwin and Boulton & Paul Ltd and built from 1892 to 1960. It was added to the Queensland Heritage Register on 11 March 2016.
This is a list of electoral district results for the 1998 Queensland state election.