Floraville, Illinois | |
|---|---|
| Coordinates: 38°22′35″N90°03′22″W / 38.37639°N 90.05611°W | |
| Country | United States |
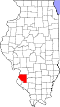
| State | Illinois |
| County | St. Clair |
| Area | |
• Total | 0.077 sq mi (0.20 km2) |
| • Land | 0.077 sq mi (0.20 km2) |
| • Water | 0 sq mi (0.00 km2) |
| Elevation | 525 ft (160 m) |
| Population (2020) | |
• Total | 49 |
| • Density | 623.5/sq mi (240.74/km2) |
| Time zone | UTC-6 (Central (CST)) |
| • Summer (DST) | UTC-5 (CDT) |
| Area code | 618 |
| GNIS feature ID | 2583438 [2] |
Floraville is a census-designated place in St. Clair County, Illinois, United States. Its population was 53 as of the 2010 census. [3]
| Census | Pop. | Note | %± |
|---|---|---|---|
| 2010 | 53 | — | |
| 2020 | 49 | −7.5% | |
| U.S. Decennial Census [4] | |||
| Race / Ethnicity (NH = Non-Hispanic) | Pop 2010 [5] | Pop 2020 [6] | % 2010 | % 2020 |
|---|---|---|---|---|
| White alone (NH) | 53 | 46 | 100.00% | 93.88% |
| Black or African American alone (NH) | 0 | 0 | 0.00% | 0.00% |
| Native American or Alaska Native alone (NH) | 0 | 0 | 0.00% | 0.00% |
| Asian alone (NH) | 0 | 0 | 0.00% | 0.00% |
| Native Hawaiian or Pacific Islander alone (NH) | 0 | 0 | 0.00% | 0.00% |
| Other race alone (NH) | 0 | 0 | 0.00% | 0.00% |
| Mixed race or Multiracial (NH) | 0 | 2 | 0.00% | 4.08% |
| Hispanic or Latino (any race) | 0 | 1 | 0.00% | 2.04% |
| Total | 53 | 49 | 100.00% | 100.00% |